Bank of America 2015 Annual Report Download - page 160
Download and view the complete annual report
Please find page 160 of the 2015 Bank of America annual report below. You can navigate through the pages in the report by either clicking on the pages listed below, or by using the keyword search tool below to find specific information within the annual report.-
 1
1 -
2
-
3
-
4
-
5
-
6
-
7
-
8
-
9
-
10
-
11
-
12
-
13
-
14
-
15
-
16
-
17
-
18
-
19
-
20
-
21
-
22
-
23
-
24
-
25
-
26
-
27
-
28
-
29
-
30
-
31
-
32
-
33
-
34
-
35
-
36
-
37
-
38
-
39
-
40
-
41
-
42
-
43
-
44
-
45
-
46
-
47
-
48
-
49
-
50
-
51
-
52
-
53
-
54
-
55
-
56
-
57
-
58
-
59
-
60
-
61
-
62
-
63
-
64
-
65
-
66
-
67
-
68
-
69
-
70
-
71
-
72
-
73
-
74
-
75
-
76
-
77
-
78
-
79
-
80
-
81
-
82
-
83
-
84
-
85
-
86
-
87
-
88
-
89
-
90
-
91
-
92
-
93
-
94
-
95
-
96
-
97
-
98
-
99
-
100
-
101
-
102
-
103
-
104
-
105
-
106
-
107
-
108
-
109
-
110
-
111
-
112
-
113
-
114
-
115
-
116
-
117
-
118
-
119
-
120
-
121
-
122
-
123
-
124
-
125
-
126
-
127
-
128
-
129
-
130
-
131
-
132
-
133
-
134
-
135
-
136
-
137
-
138
-
139
-
140
-
141
-
142
-
143
-
144
-
145
-
146
-
147
-
148
-
149
-
 150
150 -
 151
151 -
 152
152 -
 153
153 -
 154
154 -
 155
155 -
 156
156 -
 157
157 -
 158
158 -
 159
159 -
 160
160 -
 161
161 -
 162
162 -
 163
163 -
 164
164 -
 165
165 -
 166
166 -
 167
167 -
 168
168 -
 169
169 -
 170
170 -
171
-
172
-
173
-
174
-
175
-
176
-
177
-
178
-
179
-
180
-
181
-
182
-
183
-
184
-
185
-
186
-
187
-
188
-
189
-
190
-
191
-
192
-
193
-
194
-
195
-
196
-
197
-
198
-
199
-
200
-
201
-
202
-
203
-
204
-
205
-
206
-
207
-
208
-
209
-
210
-
211
-
212
-
213
-
214
-
215
-
216
-
217
-
218
-
219
-
220
-
221
-
222
-
223
-
224
-
225
-
226
-
227
-
228
-
229
-
230
-
231
-
232
-
233
-
234
-
235
-
236
-
237
-
238
-
239
-
240
-
241
-
242
-
243
-
244
-
245
-
246
-
247
-
248
-
249
-
250
-
251
-
252
-
253
-
254
-
255
-
256
 |
 |

158 Bank of America 2015
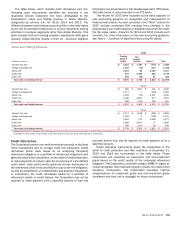
The table below presents the components of other debt
securities carried at fair value where the changes in fair value are
reported in other income. In 2015, the Corporation recorded
unrealized mark-to-market net gains of $43 million and realized
net losses of $313 million, compared to unrealized mark-to-market
net gains of $1.2 billion and realized net gains of $275 million in
2014. These amounts exclude hedge results.
Other Debt Securities Carried at Fair Value
December 31
(Dollars in millions) 2015 2014
Mortgage-backed securities:
Agency $—
$ 15,704
Agency-collateralized mortgage obligations 7—
Non-agency residential 3,490 3,745
Total mortgage-backed securities 3,497 19,449
U.S. Treasury and agency securities —1,541
Non-U.S. securities (1) 12,843 15,132
Other taxable securities, substantially all
asset-backed securities 267 299
Total $ 16,607 $ 36,421
(1) These securities are primarily used to satisfy certain international regulatory liquidity
requirements.
The gross realized gains and losses on sales of AFS debt
securities for 2015, 2014 and 2013 are presented in the table
below.
Gains and Losses on Sales of AFS Debt Securities
(Dollars in millions) 2015 2014 2013
Gross gains $ 1,118 $ 1,366 $ 1,302
Gross losses (27) (12) (31)
Net gains on sales of AFS debt securities $ 1,091 $ 1,354 $ 1,271
Income tax expense attributable to realized
net gains on sales of AFS debt securities $ 415 $ 515 $ 470