Bank of America 2015 Annual Report Download - page 88
Download and view the complete annual report
Please find page 88 of the 2015 Bank of America annual report below. You can navigate through the pages in the report by either clicking on the pages listed below, or by using the keyword search tool below to find specific information within the annual report.-
 1
1 -
2
-
3
-
4
-
5
-
6
-
7
-
8
-
9
-
10
-
11
-
12
-
13
-
14
-
15
-
16
-
17
-
18
-
19
-
20
-
21
-
22
-
23
-
24
-
25
-
26
-
27
-
28
-
29
-
30
-
31
-
32
-
33
-
34
-
35
-
36
-
37
-
38
-
39
-
40
-
41
-
42
-
43
-
44
-
45
-
46
-
47
-
48
-
49
-
50
-
51
-
52
-
53
-
54
-
55
-
56
-
57
-
58
-
59
-
60
-
61
-
62
-
63
-
64
-
65
-
66
-
67
-
68
-
69
-
70
-
71
-
72
-
73
-
74
-
75
-
76
-
77
-
 78
78 -
 79
79 -
 80
80 -
 81
81 -
 82
82 -
 83
83 -
 84
84 -
 85
85 -
 86
86 -
 87
87 -
 88
88 -
 89
89 -
 90
90 -
 91
91 -
 92
92 -
 93
93 -
 94
94 -
 95
95 -
 96
96 -
 97
97 -
 98
98 -
99
-
100
-
101
-
102
-
103
-
104
-
105
-
106
-
107
-
108
-
109
-
110
-
111
-
112
-
113
-
114
-
115
-
116
-
117
-
118
-
119
-
120
-
121
-
122
-
123
-
124
-
125
-
126
-
127
-
128
-
129
-
130
-
131
-
132
-
133
-
134
-
135
-
136
-
137
-
138
-
139
-
140
-
141
-
142
-
143
-
144
-
145
-
146
-
147
-
148
-
149
-
150
-
151
-
152
-
153
-
154
-
155
-
156
-
157
-
158
-
159
-
160
-
161
-
162
-
163
-
164
-
165
-
166
-
167
-
168
-
169
-
170
-
171
-
172
-
173
-
174
-
175
-
176
-
177
-
178
-
179
-
180
-
181
-
182
-
183
-
184
-
185
-
186
-
187
-
188
-
189
-
190
-
191
-
192
-
193
-
194
-
195
-
196
-
197
-
198
-
199
-
200
-
201
-
202
-
203
-
204
-
205
-
206
-
207
-
208
-
209
-
210
-
211
-
212
-
213
-
214
-
215
-
216
-
217
-
218
-
219
-
220
-
221
-
222
-
223
-
224
-
225
-
226
-
227
-
228
-
229
-
230
-
231
-
232
-
233
-
234
-
235
-
236
-
237
-
238
-
239
-
240
-
241
-
242
-
243
-
244
-
245
-
246
-
247
-
248
-
249
-
250
-
251
-
252
-
253
-
254
-
255
-
256
 |
 |

86 Bank of America 2015
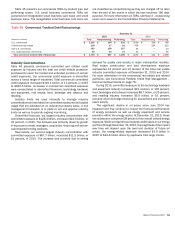
Table 53 Total Cross-border Exposure Exceeding One Percent of Total Assets
(Dollars in millions) December 31 Public Sector Banks Private Sector
Cross-border
Exposure
Exposure as a
Percent of
Total Assets
United Kingdom 2015 $ 3,264 $ 5,104 $ 38,576 $ 46,944 2.19%
2014 11 2,056 34,595 36,662 1.74
France 2015 3,343 1,766 17,099 22,208 1.04
2014 4,479 2,631 14,368 21,478 1.02
Provision for Credit Losses
The provision for credit losses increased $886 million to $3.2
billion in 2015 compared to 2014. The provision for credit losses
was $1.2 billion lower than net charge-offs for 2015, resulting in
a reduction in the allowance for credit losses. This compared to
a reduction of $2.1 billion in the allowance for credit losses in
2014. As we look at 2016, reserve releases are expected to
decrease from 2015 levels. All else equal, this would result in
increased provision expense, assuming sustained stability in
underlying asset quality.
The provision for credit losses for the consumer portfolio
increased $726 million to $2.2 billion in 2015 compared to 2014.
The provision for credit losses in 2014 included $400 million of
additional costs associated with the consumer relief portion of
the DoJ Settlement. Excluding these additional costs, the
consumer provision for credit losses increased due to a slower
pace of portfolio improvement than in 2014, and also due to a
lower level of recoveries on nonperforming loan sales and other
recoveries in 2015. Included in the provision is a benefit of $40
million related to the PCI loan portfolio for 2015 compared to a
benefit of $31 million in 2014.
The provision for credit losses for the commercial portfolio,
including unfunded lending commitments, increased $160 million
to $953 million in 2015 compared to 2014 driven by energy sector
exposure and higher unfunded balances.
Allowance for Credit Losses
Allowance for Loan and Lease Losses
The allowance for loan and lease losses is comprised of two
components. The first component covers nonperforming
commercial loans and TDRs. The second component covers loans
and leases on which there are incurred losses that are not yet
individually identifiable, as well as incurred losses that may not
be represented in the loss forecast models. We evaluate the
adequacy of the allowance for loan and lease losses based on the
total of these two components, each of which is described in more
detail below. The allowance for loan and lease losses excludes
LHFS and loans accounted for under the fair value option as the
fair value reflects a credit risk component.
The first component of the allowance for loan and lease losses
covers both nonperforming commercial loans and all TDRs within
the consumer and commercial portfolios. These loans are subject
to impairment measurement based on the present value of
projected future cash flows discounted at the loan’s original
effective interest rate, or in certain circumstances, impairment
may also be based upon the collateral value or the loan’s
observable market price if available. Impairment measurement for
the renegotiated consumer credit card, small business credit card
and unsecured consumer TDR portfolios is based on the present
value of projected cash flows discounted using the average
portfolio contractual interest rate, excluding promotionally priced
loans, in effect prior to restructuring. For purposes of computing
this specific loss component of the allowance, larger impaired
loans are evaluated individually and smaller impaired loans are
evaluated as a pool using historical experience for the respective
product types and risk ratings of the loans.
The second component of the allowance for loan and lease
losses covers the remaining consumer and commercial loans and
leases that have incurred losses that are not yet individually
identifiable. The allowance for consumer and certain
homogeneous commercial loan and lease products is based on
aggregated portfolio evaluations, generally by product type. Loss
forecast models are utilized that consider a variety of factors
including, but not limited to, historical loss experience, estimated
defaults or foreclosures based on portfolio trends, delinquencies,
economic trends and credit scores. Our consumer real estate loss
forecast model estimates the portion of loans that will default
based on individual loan attributes, the most significant of which
are refreshed LTV or CLTV, and borrower credit score as well as
vintage and geography, all of which are further broken down into
current delinquency status. Additionally, we incorporate the
delinquency status of underlying first-lien loans on our junior-lien
home equity portfolio in our allowance process. Incorporating
refreshed LTV and CLTV into our probability of default allows us to
factor the impact of changes in home prices into our allowance
for loan and lease losses. These loss forecast models are updated
on a quarterly basis to incorporate information reflecting the
current economic environment. As of December 31, 2015, the loss
forecast process resulted in reductions in the allowance for all
major consumer portfolios compared to December 31, 2014.
The allowance for commercial loan and lease losses is
established by product type after analyzing historical loss
experience, internal risk rating, current economic conditions,
industry performance trends, geographic and obligor
concentrations within each portfolio and any other pertinent
information. The statistical models for commercial loans are
generally updated annually and utilize our historical database of
actual defaults and other data, including external default data. The
loan risk ratings and composition of the commercial portfolios
used to calculate the allowance are updated quarterly to
incorporate the most recent data reflecting the current economic
environment. For risk-rated commercial loans, we estimate the
probability of default and the LGD based on our historical
experience of defaults and credit losses. Factors considered when
assessing the internal risk rating include the value of the underlying
collateral, if applicable, the industry in which the obligor operates,
the obligor’s liquidity and other financial indicators, and other
quantitative and qualitative factors relevant to the obligor’s credit
risk. As of December 31, 2015, the allowance increased for the