Bank of America 2015 Annual Report Download - page 124
Download and view the complete annual report
Please find page 124 of the 2015 Bank of America annual report below. You can navigate through the pages in the report by either clicking on the pages listed below, or by using the keyword search tool below to find specific information within the annual report.-
 1
1 -
2
-
3
-
4
-
5
-
6
-
7
-
8
-
9
-
10
-
11
-
12
-
13
-
14
-
15
-
16
-
17
-
18
-
19
-
20
-
21
-
22
-
23
-
24
-
25
-
26
-
27
-
28
-
29
-
30
-
31
-
32
-
33
-
34
-
35
-
36
-
37
-
38
-
39
-
40
-
41
-
42
-
43
-
44
-
45
-
46
-
47
-
48
-
49
-
50
-
51
-
52
-
53
-
54
-
55
-
56
-
57
-
58
-
59
-
60
-
61
-
62
-
63
-
64
-
65
-
66
-
67
-
68
-
69
-
70
-
71
-
72
-
73
-
74
-
75
-
76
-
77
-
78
-
79
-
80
-
81
-
82
-
83
-
84
-
85
-
86
-
87
-
88
-
89
-
90
-
91
-
92
-
93
-
94
-
95
-
96
-
97
-
98
-
99
-
100
-
101
-
102
-
103
-
104
-
105
-
106
-
107
-
108
-
109
-
110
-
111
-
112
-
113
-
 114
114 -
 115
115 -
 116
116 -
 117
117 -
 118
118 -
 119
119 -
 120
120 -
 121
121 -
 122
122 -
 123
123 -
 124
124 -
 125
125 -
 126
126 -
 127
127 -
 128
128 -
 129
129 -
 130
130 -
 131
131 -
 132
132 -
 133
133 -
 134
134 -
135
-
136
-
137
-
138
-
139
-
140
-
141
-
142
-
143
-
144
-
145
-
146
-
147
-
148
-
149
-
150
-
151
-
152
-
153
-
154
-
155
-
156
-
157
-
158
-
159
-
160
-
161
-
162
-
163
-
164
-
165
-
166
-
167
-
168
-
169
-
170
-
171
-
172
-
173
-
174
-
175
-
176
-
177
-
178
-
179
-
180
-
181
-
182
-
183
-
184
-
185
-
186
-
187
-
188
-
189
-
190
-
191
-
192
-
193
-
194
-
195
-
196
-
197
-
198
-
199
-
200
-
201
-
202
-
203
-
204
-
205
-
206
-
207
-
208
-
209
-
210
-
211
-
212
-
213
-
214
-
215
-
216
-
217
-
218
-
219
-
220
-
221
-
222
-
223
-
224
-
225
-
226
-
227
-
228
-
229
-
230
-
231
-
232
-
233
-
234
-
235
-
236
-
237
-
238
-
239
-
240
-
241
-
242
-
243
-
244
-
245
-
246
-
247
-
248
-
249
-
250
-
251
-
252
-
253
-
254
-
255
-
256
 |
 |

122 Bank of America 2015
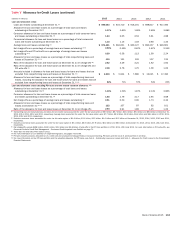
Table XIV Two-year Reconciliations to GAAP Financial Measures (1, 2)
(Dollars in millions) 2015 2014
Consumer Banking
Reported net income $ 6,739 $ 6,436
Adjustment related to intangibles (3) 44
Adjusted net income $ 6,743 $ 6,440
Average allocated equity (4) $59,319 $ 60,398
Adjustment related to goodwill and a percentage of intangibles (30,319) (30,398)
Average allocated capital $ 29,000 $ 30,000
Deposits
Reported net income $ 2,685 $ 2,415
Adjustment related to intangibles (3) ——
Adjusted net income $ 2,685 $ 2,415
Average allocated equity (4) $30,420 $ 29,432
Adjustment related to goodwill and a percentage of intangibles (18,420) (18,432)
Average allocated capital $ 12,000 $ 11,000
Consumer Lending
Reported net income $ 4,054 $ 4,021
Adjustment related to intangibles (3) 44
Adjusted net income $ 4,058 $ 4,025
Average allocated equity (4) $28,900 $ 30,966
Adjustment related to goodwill and a percentage of intangibles (11,900) (11,966)
Average allocated capital $ 17,000 $ 19,000
Global Wealth & Investment Management
Reported net income $ 2,609 $ 2,969
Adjustment related to intangibles (3) 11 13
Adjusted net income $ 2,620 $ 2,982
Average allocated equity (4) $22,130 $ 22,214
Adjustment related to goodwill and a percentage of intangibles (10,130) (10,214)
Average allocated capital $ 12,000 $ 12,000
Global Banking
Reported net income $ 5,273 $ 5,769
Adjustment related to intangibles (3) 12
Adjusted net income $ 5,274 $ 5,771
Average allocated equity (4) $58,935 $ 57,429
Adjustment related to goodwill and a percentage of intangibles (23,935) (23,929)
Average allocated capital $ 35,000 $ 33,500
Global Markets
Reported net income $ 2,496 $ 2,705
Adjustment related to intangibles (3) 10 9
Adjusted net income $ 2,506 $ 2,714
Average allocated equity (4) $40,392 $ 39,394
Adjustment related to goodwill and a percentage of intangibles (5,392)(5,394)
Average allocated capital $ 35,000 $ 34,000
(1) Presents reconciliations of non-GAAP financial measures to GAAP financial measures. We believe the use of these non-GAAP financial measures provides additional clarity in assessing the results
of the Corporation and our segments. Other companies may define or calculate these measures differently. For more information on non-GAAP financial measures and ratios we use in assessing the
results of the Corporation, see Supplemental Financial Data on page 28.
(2) There are no adjustments to reported net income (loss) or average allocated equity for LAS.
(3) Represents cost of funds, earnings credits and certain expenses related to intangibles.
(4) Average allocated equity is comprised of average allocated capital plus capital for the portion of goodwill and intangibles specifically assigned to the business segment. For more information on
allocated capital, see Business Segment Operations on page 30 and Note 8 – Goodwill and Intangible Assets to the Consolidated Financial Statements.