Bank of America 2015 Annual Report Download - page 31
Download and view the complete annual report
Please find page 31 of the 2015 Bank of America annual report below. You can navigate through the pages in the report by either clicking on the pages listed below, or by using the keyword search tool below to find specific information within the annual report.-
 1
1 -
2
-
3
-
4
-
5
-
6
-
7
-
8
-
9
-
10
-
11
-
12
-
13
-
14
-
15
-
16
-
17
-
18
-
19
-
20
-
 21
21 -
 22
22 -
 23
23 -
 24
24 -
 25
25 -
 26
26 -
 27
27 -
 28
28 -
 29
29 -
 30
30 -
 31
31 -
 32
32 -
 33
33 -
 34
34 -
 35
35 -
 36
36 -
 37
37 -
 38
38 -
 39
39 -
 40
40 -
 41
41 -
42
-
43
-
44
-
45
-
46
-
47
-
48
-
49
-
50
-
51
-
52
-
53
-
54
-
55
-
56
-
57
-
58
-
59
-
60
-
61
-
62
-
63
-
64
-
65
-
66
-
67
-
68
-
69
-
70
-
71
-
72
-
73
-
74
-
75
-
76
-
77
-
78
-
79
-
80
-
81
-
82
-
83
-
84
-
85
-
86
-
87
-
88
-
89
-
90
-
91
-
92
-
93
-
94
-
95
-
96
-
97
-
98
-
99
-
100
-
101
-
102
-
103
-
104
-
105
-
106
-
107
-
108
-
109
-
110
-
111
-
112
-
113
-
114
-
115
-
116
-
117
-
118
-
119
-
120
-
121
-
122
-
123
-
124
-
125
-
126
-
127
-
128
-
129
-
130
-
131
-
132
-
133
-
134
-
135
-
136
-
137
-
138
-
139
-
140
-
141
-
142
-
143
-
144
-
145
-
146
-
147
-
148
-
149
-
150
-
151
-
152
-
153
-
154
-
155
-
156
-
157
-
158
-
159
-
160
-
161
-
162
-
163
-
164
-
165
-
166
-
167
-
168
-
169
-
170
-
171
-
172
-
173
-
174
-
175
-
176
-
177
-
178
-
179
-
180
-
181
-
182
-
183
-
184
-
185
-
186
-
187
-
188
-
189
-
190
-
191
-
192
-
193
-
194
-
195
-
196
-
197
-
198
-
199
-
200
-
201
-
202
-
203
-
204
-
205
-
206
-
207
-
208
-
209
-
210
-
211
-
212
-
213
-
214
-
215
-
216
-
217
-
218
-
219
-
220
-
221
-
222
-
223
-
224
-
225
-
226
-
227
-
228
-
229
-
230
-
231
-
232
-
233
-
234
-
235
-
236
-
237
-
238
-
239
-
240
-
241
-
242
-
243
-
244
-
245
-
246
-
247
-
248
-
249
-
250
-
251
-
252
-
253
-
254
-
255
-
256
 |
 |

Bank of America 2015 29
measures to support our overall growth goals. These ratios are as
follows:
Return on average tangible common shareholders’ equity
measures our earnings contribution as a percentage of adjusted
common shareholders’ equity. The tangible common equity ratio
represents adjusted ending common shareholders’ equity
divided by total assets less goodwill and intangible assets
(excluding MSRs), net of related deferred tax liabilities.
Return on average tangible shareholders’ equity measures our
earnings contribution as a percentage of adjusted average total
shareholders’ equity. The tangible equity ratio represents
adjusted ending shareholders’ equity divided by total assets
less goodwill and intangible assets (excluding MSRs), net of
related deferred tax liabilities.
Tangible book value per common share represents adjusted
ending common shareholders’ equity divided by ending common
shares outstanding.
The aforementioned supplemental data and performance
measures are presented in Table 8 and Statistical Table X.
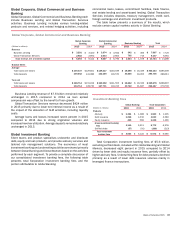
We evaluate our business segment results based on measures
that utilize average allocated capital. Return on average allocated
capital is calculated as net income adjusted for cost of funds and
earnings credits and certain expenses related to intangibles,
divided by average allocated capital. Allocated capital and the
related return both represent non-GAAP financial measures.
Statistical Tables XIII, XIV and XV on pages 121, 122 and 123
provide reconciliations of these non-GAAP financial measures to
GAAP financial measures. We believe the use of these non-GAAP
financial measures provides additional clarity in assessing the
results of the Corporation and our segments. Other companies
may define or calculate these measures and ratios differently.
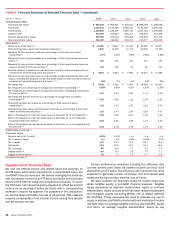
Table 9 Five-year Supplemental Financial Data
(Dollars in millions, except per share information) 2015 2014 2013 2012 2011
Fully taxable-equivalent basis data
Net interest income $ 40,160 $ 40,821 $ 43,124 $ 41,557 $ 45,588
Total revenue, net of interest expense (1) 83,416 85,116 89,801 84,235 94,426
Net interest yield 2.20%2.25% 2.37% 2.24% 2.38%
Efficiency ratio (1) 68.56 88.25 77.07 85.59 85.01
(1) The results for 2015 were impacted by the early adoption of new accounting guidance on recognition and measurement of financial instruments. For additional information, see Executive Summary
– Recent Events on page 20.
Net Interest Income Excluding Trading-related Net
Interest Income
We manage net interest income on an FTE basis and excluding
the impact of trading-related activities. We evaluate our sales and
trading results and strategies on a total market-based revenue
approach by combining net interest income and noninterest
income for Global Markets. An analysis of net interest income,
average earning assets and net interest yield on earning assets,
all of which adjust for the impact of trading-related net interest
income from reported net interest income on an FTE basis, is
shown below. We believe the use of this non-GAAP presentation
in Table 10 provides additional clarity in assessing our results.
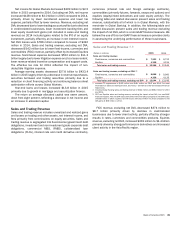
Table 10 Net Interest Income Excluding Trading-related
Net Interest Income
(Dollars in millions) 2015 2014
Net interest income (FTE basis)
As reported $ 40,160 $ 40,821
Impact of trading-related net interest income (3,928) (3,610)
Net interest income excluding trading-related
net interest income (FTE basis) (1) $ 36,232 $ 37,211
Average earning assets
As reported $ 1,830,342 $1,814,930
Impact of trading-related earning assets (415,658) (445,760)
Average earning assets excluding trading-
related earning assets (1) $ 1,414,684 $1,369,170
Net interest yield contribution (FTE basis)
As reported 2.20% 2.25%
Impact of trading-related activities 0.36 0.47
Net interest yield on earning assets excluding
trading-related activities (FTE basis) (1) 2.56% 2.72%
(1) Represents a non-GAAP financial measure.
Net interest income excluding trading-related net interest
income decreased $979 million to $36.2 billion for 2015
compared to 2014. The decline was primarily driven by lower loan
yields and consumer loan balances, as well as a charge of $612
million in 2015 related to the discount on certain trust preferred
securities. This was partially offset by a $785 million improvement
in market-related adjustments on debt securities, lower funding
costs, lower rates paid on deposits and commercial loan growth.
Market-related adjustments on debt securities resulted in an
expense of $296 million in 2015 compared to an expense of $1.1
billion in 2014. For more information on market-related and other
adjustments, see Executive Summary – Financial Highlights on
page 22. For more information on the impact of interest rates, see
Interest Rate Risk Management for Non-trading Activities on page
95.
Average earning assets excluding trading-related earning
assets increased $45.5 billion to $1,414.7 billion for 2015
compared to 2014. The increase was primarily in debt securities,
commercial loans and cash held at central banks, partially offset
by a decline in consumer loans.
Net interest yield on earning assets excluding trading-related
activities decreased 16 bps to 2.56 percent for 2015 compared
to 2014 due to the same factors as described above.