Bank of America 2015 Annual Report Download - page 84
Download and view the complete annual report
Please find page 84 of the 2015 Bank of America annual report below. You can navigate through the pages in the report by either clicking on the pages listed below, or by using the keyword search tool below to find specific information within the annual report.-
 1
1 -
2
-
3
-
4
-
5
-
6
-
7
-
8
-
9
-
10
-
11
-
12
-
13
-
14
-
15
-
16
-
17
-
18
-
19
-
20
-
21
-
22
-
23
-
24
-
25
-
26
-
27
-
28
-
29
-
30
-
31
-
32
-
33
-
34
-
35
-
36
-
37
-
38
-
39
-
40
-
41
-
42
-
43
-
44
-
45
-
46
-
47
-
48
-
49
-
50
-
51
-
52
-
53
-
54
-
55
-
56
-
57
-
58
-
59
-
60
-
61
-
62
-
63
-
64
-
65
-
66
-
67
-
68
-
69
-
70
-
71
-
72
-
73
-
 74
74 -
 75
75 -
 76
76 -
 77
77 -
 78
78 -
 79
79 -
 80
80 -
 81
81 -
 82
82 -
 83
83 -
 84
84 -
 85
85 -
 86
86 -
 87
87 -
 88
88 -
 89
89 -
 90
90 -
 91
91 -
 92
92 -
 93
93 -
 94
94 -
95
-
96
-
97
-
98
-
99
-
100
-
101
-
102
-
103
-
104
-
105
-
106
-
107
-
108
-
109
-
110
-
111
-
112
-
113
-
114
-
115
-
116
-
117
-
118
-
119
-
120
-
121
-
122
-
123
-
124
-
125
-
126
-
127
-
128
-
129
-
130
-
131
-
132
-
133
-
134
-
135
-
136
-
137
-
138
-
139
-
140
-
141
-
142
-
143
-
144
-
145
-
146
-
147
-
148
-
149
-
150
-
151
-
152
-
153
-
154
-
155
-
156
-
157
-
158
-
159
-
160
-
161
-
162
-
163
-
164
-
165
-
166
-
167
-
168
-
169
-
170
-
171
-
172
-
173
-
174
-
175
-
176
-
177
-
178
-
179
-
180
-
181
-
182
-
183
-
184
-
185
-
186
-
187
-
188
-
189
-
190
-
191
-
192
-
193
-
194
-
195
-
196
-
197
-
198
-
199
-
200
-
201
-
202
-
203
-
204
-
205
-
206
-
207
-
208
-
209
-
210
-
211
-
212
-
213
-
214
-
215
-
216
-
217
-
218
-
219
-
220
-
221
-
222
-
223
-
224
-
225
-
226
-
227
-
228
-
229
-
230
-
231
-
232
-
233
-
234
-
235
-
236
-
237
-
238
-
239
-
240
-
241
-
242
-
243
-
244
-
245
-
246
-
247
-
248
-
249
-
250
-
251
-
252
-
253
-
254
-
255
-
256
 |
 |

82 Bank of America 2015
Our committed state and municipal exposure of $43.4 billion
at December 31, 2015 consisted of $35.9 billion of commercial
utilized exposure (including $20.0 billion of funded loans, $6.4
billion of SBLCs and $2.2 billion of derivative assets) and $7.5
billion of unfunded commercial exposure (primarily unfunded loan
commitments and letters of credit) and is reported in the
government and public education industry in Table 46. With the
U.S. economy gradually strengthening, most state and local
governments are experiencing improved fiscal circumstances and
continue to honor debt obligations as agreed. While historical
default rates have been low, as part of our overall and ongoing
risk management processes, we continually monitor these
exposures through a rigorous review process. Additionally, internal
communications are regularly circulated such that exposure levels
are maintained in compliance with established concentration
guidelines.
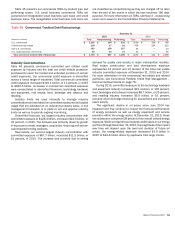
Table 46 Commercial Credit Exposure by Industry (1)
December 31
Commercial
Utilized
Total Commercial
Committed
(Dollars in millions) 2015 2014 2015 2014
Diversified financials $ 79,496 $ 63,306 $ 128,436 $ 103,528
Real estate (2) 61,759 53,834 87,650 76,153
Retailing 37,675 33,683 63,975 58,043
Capital goods 30,790 29,028 58,583 54,653
Healthcare equipment and services 35,134 32,923 57,901 52,450
Banking 45,952 42,330 53,825 48,353
Government and public education 44,835 42,095 53,133 49,937
Materials 24,012 23,664 46,013 45,821
Energy 21,257 23,830 43,811 47,667
Food, beverage and tobacco 18,316 16,131 43,164 34,465
Consumer services 24,084 21,657 37,058 33,269
Commercial services and supplies 19,552 17,997 32,045 30,451
Utilities 11,396 9,399 27,849 25,235
Transportation 19,369 17,538 27,371 24,541
Technology hardware and equipment 6,337 5,489 24,734 12,350
Media 12,833 11,128 24,194 21,502
Individuals and trusts 17,992 16,749 23,176 21,195
Software and services 6,617 5,927 18,362 14,071
Pharmaceuticals and biotechnology 6,302 5,707 16,472 13,493
Automobiles and components 4,804 4,114 11,329 9,683
Consumer durables and apparel 6,053 6,111 11,165 10,613
Insurance, including monolines 5,095 5,204 10,728 11,252
Telecommunication services 4,717 3,814 10,645 9,295
Food and staples retailing 4,351 3,848 9,439 7,418
Religious and social organizations 4,526 4,881 5,929 6,548
Other 6,309 6,255 15,510 10,415
Total commercial credit exposure by industry $ 559,563 $506,642 $ 942,497 $ 832,401
Net credit default protection purchased on total commitments (3) $(6,677)$ (7,302)
(1) Includes U.S. small business commercial exposure.
(2) Industries are viewed from a variety of perspectives to best isolate the perceived risks. For purposes of this table, the real estate industry is defined based on the borrowers’ or counterparties’
primary business activity using operating cash flows and primary source of repayment as key factors.
(3) Represents net notional credit protection purchased. For additional information, see Commercial Portfolio Credit Risk Management – Risk Mitigation on page 82.
Risk Mitigation
We purchase credit protection to cover the funded portion as well
as the unfunded portion of certain credit exposures. To lower the
cost of obtaining our desired credit protection levels, we may add
credit exposure within an industry, borrower or counterparty group
by selling protection.
At December 31, 2015 and 2014, net notional credit default
protection purchased in our credit derivatives portfolio to hedge
our funded and unfunded exposures for which we elected the fair
value option, as well as certain other credit exposures, was $6.7
billion and $7.3 billion. We recorded net gains of $150 million in
2015 compared to net losses of $50 million in 2014 on these
positions. The gains and losses on these instruments were offset
by gains and losses on the related exposures. The Value-at-Risk
(VaR) results for these exposures are included in the fair value
option portfolio information in Table 56. For additional information,
see Trading Risk Management on page 91.
Tables 47 and 48 present the maturity profiles and the credit
exposure debt ratings of the net credit default protection portfolio
at December 31, 2015 and 2014.
Table 47 Net Credit Default Protection by Maturity
December 31
2015 2014
Less than or equal to one year 39% 43%
Greater than one year and less than or equal to five
years 59 55
Greater than five years 22
Total net credit default protection 100% 100%