Bank of America 2015 Annual Report Download - page 239
Download and view the complete annual report
Please find page 239 of the 2015 Bank of America annual report below. You can navigate through the pages in the report by either clicking on the pages listed below, or by using the keyword search tool below to find specific information within the annual report.-
 1
1 -
2
-
3
-
4
-
5
-
6
-
7
-
8
-
9
-
10
-
11
-
12
-
13
-
14
-
15
-
16
-
17
-
18
-
19
-
20
-
21
-
22
-
23
-
24
-
25
-
26
-
27
-
28
-
29
-
30
-
31
-
32
-
33
-
34
-
35
-
36
-
37
-
38
-
39
-
40
-
41
-
42
-
43
-
44
-
45
-
46
-
47
-
48
-
49
-
50
-
51
-
52
-
53
-
54
-
55
-
56
-
57
-
58
-
59
-
60
-
61
-
62
-
63
-
64
-
65
-
66
-
67
-
68
-
69
-
70
-
71
-
72
-
73
-
74
-
75
-
76
-
77
-
78
-
79
-
80
-
81
-
82
-
83
-
84
-
85
-
86
-
87
-
88
-
89
-
90
-
91
-
92
-
93
-
94
-
95
-
96
-
97
-
98
-
99
-
100
-
101
-
102
-
103
-
104
-
105
-
106
-
107
-
108
-
109
-
110
-
111
-
112
-
113
-
114
-
115
-
116
-
117
-
118
-
119
-
120
-
121
-
122
-
123
-
124
-
125
-
126
-
127
-
128
-
129
-
130
-
131
-
132
-
133
-
134
-
135
-
136
-
137
-
138
-
139
-
140
-
141
-
142
-
143
-
144
-
145
-
146
-
147
-
148
-
149
-
150
-
151
-
152
-
153
-
154
-
155
-
156
-
157
-
158
-
159
-
160
-
161
-
162
-
163
-
164
-
165
-
166
-
167
-
168
-
169
-
170
-
171
-
172
-
173
-
174
-
175
-
176
-
177
-
178
-
179
-
180
-
181
-
182
-
183
-
184
-
185
-
186
-
187
-
188
-
189
-
190
-
191
-
192
-
193
-
194
-
195
-
196
-
197
-
198
-
199
-
200
-
201
-
202
-
203
-
204
-
205
-
206
-
207
-
208
-
209
-
210
-
211
-
212
-
213
-
214
-
215
-
216
-
217
-
218
-
219
-
220
-
221
-
222
-
223
-
224
-
225
-
226
-
227
-
228
-
 229
229 -
 230
230 -
 231
231 -
 232
232 -
 233
233 -
 234
234 -
 235
235 -
 236
236 -
 237
237 -
 238
238 -
 239
239 -
 240
240 -
 241
241 -
 242
242 -
 243
243 -
 244
244 -
 245
245 -
 246
246 -
 247
247 -
 248
248 -
 249
249 -
250
-
251
-
252
-
253
-
254
-
255
-
256
 |
 |

Bank of America 2015 237
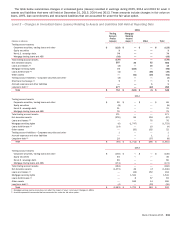
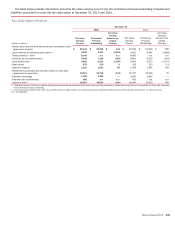
Nonrecurring Fair Value
The Corporation holds certain assets that are measured at fair value, but only in certain situations (e.g., impairment) and these
measurements are referred to herein as nonrecurring. The amounts below represent assets still held as of the reporting date for which
a nonrecurring fair value adjustment was recorded during 2015, 2014 and 2013.
Assets Measured at Fair Value on a Nonrecurring Basis
December 31
2015 2014
(Dollars in millions) Level 2 Level 3 Level 2 Level 3
Assets
Loans held-for-sale $ 9$ 33 $ 156 $ 30
Loans and leases (1) — 2,739 5 4,636
Foreclosed properties (2, 3) —172 — 208
Other assets 54 —13 —
Gains (Losses)
2015 2014 2013
Assets
Loans held-for-sale $(8)$ (19) $ (71)
Loans and leases (1) (980)(1,132) (1,104)
Foreclosed properties (2, 3) (57) (66) (63)
Other assets (15) (6) (20)
(1) Includes $174 million of losses on loans that were written down to a collateral value of zero during 2015 compared to losses of $370 million and $365 million in 2014 and 2013.
(2) Amounts are included in other assets on the Consolidated Balance Sheet and represent the carrying value of foreclosed properties that were written down subsequent to their initial classification
as foreclosed properties. Losses on foreclosed properties include losses taken during the first 90 days after transfer of a loan to foreclosed properties.
(3) Excludes $1.4 billion and $1.1 billion of properties acquired upon foreclosure of certain government-guaranteed loans (principally FHA-insured loans) as of December 31, 2015 and 2014.
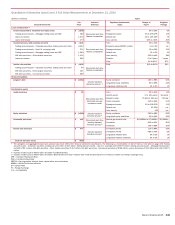
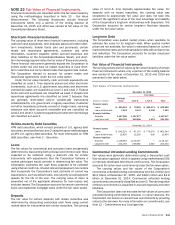
The table below presents information about significant unobservable inputs related to the Corporation’s nonrecurring Level 3 financial
assets and liabilities at December 31, 2015 and 2014. Instruments backed by residential real estate assets represent residential
mortgages where the loan has been written down to the fair value of the underlying collateral.
Quantitative Information about Nonrecurring Level 3 Fair Value Measurements
December 31, 2015
(Dollars in millions) Inputs
Financial Instrument
Fair
Value
Valuation
Technique
Significant Unobservable
Inputs
Ranges of
Inputs
Weighted
Average
Loans and leases backed by residential real estate assets $ 2,739 Market comparables OREO discount 7% to 55% 20%
Cost to sell 8% to 45% 10%
December 31, 2014
Loans and leases backed by residential real estate assets $ 4,636 Market comparables OREO discount 0% to 28% 8%
Cost to sell 7% to 14% 8%