Bank of America 2015 Annual Report Download - page 228
Download and view the complete annual report
Please find page 228 of the 2015 Bank of America annual report below. You can navigate through the pages in the report by either clicking on the pages listed below, or by using the keyword search tool below to find specific information within the annual report.-
 1
1 -
2
-
3
-
4
-
5
-
6
-
7
-
8
-
9
-
10
-
11
-
12
-
13
-
14
-
15
-
16
-
17
-
18
-
19
-
20
-
21
-
22
-
23
-
24
-
25
-
26
-
27
-
28
-
29
-
30
-
31
-
32
-
33
-
34
-
35
-
36
-
37
-
38
-
39
-
40
-
41
-
42
-
43
-
44
-
45
-
46
-
47
-
48
-
49
-
50
-
51
-
52
-
53
-
54
-
55
-
56
-
57
-
58
-
59
-
60
-
61
-
62
-
63
-
64
-
65
-
66
-
67
-
68
-
69
-
70
-
71
-
72
-
73
-
74
-
75
-
76
-
77
-
78
-
79
-
80
-
81
-
82
-
83
-
84
-
85
-
86
-
87
-
88
-
89
-
90
-
91
-
92
-
93
-
94
-
95
-
96
-
97
-
98
-
99
-
100
-
101
-
102
-
103
-
104
-
105
-
106
-
107
-
108
-
109
-
110
-
111
-
112
-
113
-
114
-
115
-
116
-
117
-
118
-
119
-
120
-
121
-
122
-
123
-
124
-
125
-
126
-
127
-
128
-
129
-
130
-
131
-
132
-
133
-
134
-
135
-
136
-
137
-
138
-
139
-
140
-
141
-
142
-
143
-
144
-
145
-
146
-
147
-
148
-
149
-
150
-
151
-
152
-
153
-
154
-
155
-
156
-
157
-
158
-
159
-
160
-
161
-
162
-
163
-
164
-
165
-
166
-
167
-
168
-
169
-
170
-
171
-
172
-
173
-
174
-
175
-
176
-
177
-
178
-
179
-
180
-
181
-
182
-
183
-
184
-
185
-
186
-
187
-
188
-
189
-
190
-
191
-
192
-
193
-
194
-
195
-
196
-
197
-
198
-
199
-
200
-
201
-
202
-
203
-
204
-
205
-
206
-
207
-
208
-
209
-
210
-
211
-
212
-
213
-
214
-
215
-
216
-
217
-
 218
218 -
 219
219 -
 220
220 -
 221
221 -
 222
222 -
 223
223 -
 224
224 -
 225
225 -
 226
226 -
 227
227 -
 228
228 -
 229
229 -
 230
230 -
 231
231 -
 232
232 -
 233
233 -
 234
234 -
 235
235 -
 236
236 -
 237
237 -
 238
238 -
239
-
240
-
241
-
242
-
243
-
244
-
245
-
246
-
247
-
248
-
249
-
250
-
251
-
252
-
253
-
254
-
255
-
256
 |
 |

226 Bank of America 2015
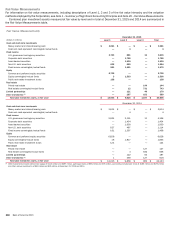
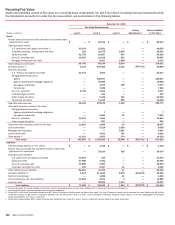
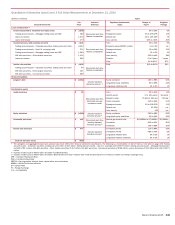
Recurring Fair Value
Assets and liabilities carried at fair value on a recurring basis at December 31, 2015 and 2014, including financial instruments which
the Corporation accounts for under the fair value option, are summarized in the following tables.
December 31, 2015
Fair Value Measurements
(Dollars in millions) Level 1 Level 2 Level 3
Netting
Adjustments (1)
Assets/Liabilities
at Fair Value
Assets
Federal funds sold and securities borrowed or purchased under
agreements to resell $ — $ 55,143 $ —$ —$ 55,143
Trading account assets:
U.S. government and agency securities (2) 33,034 15,501 — —48,535
Corporate securities, trading loans and other 325 22,738 2,838 —25,901
Equity securities 41,735 20,887 407 — 63,029
Non-U.S. sovereign debt 15,651 12,915 521 — 29,087
Mortgage trading loans and ABS — 8,107 1,868 —9,975
Total trading account assets 90,745 80,148 5,634 —176,527
Derivative assets (3) 5,149 679,458 5,134 (639,751) 49,990
AFS debt securities:
U.S. Treasury and agency securities 23,374 1,903 — —25,277
Mortgage-backed securities:
Agency — 228,947 — —228,947
Agency-collateralized mortgage obligations — 10,985 — —10,985
Non-agency residential — 3,073 106 — 3,179
Commercial — 7,165 — —7,165
Non-U.S. securities 2,768 2,999 — —5,767
Corporate/Agency bonds —243 ——243
Other taxable securities — 9,445 757 — 10,202
Tax-exempt securities — 13,439 569 — 14,008
Total AFS debt securities 26,142 278,199 1,432 —305,773
Other debt securities carried at fair value:
Mortgage-backed securities:
Agency-collateralized mortgage obligations — 7 — —7
Non-agency residential — 3,460 30 —3,490
Non-U.S. securities 11,691 1,152 — —12,843
Other taxable securities —267 ——267
Total other debt securities carried at fair value 11,691 4,886 30 —16,607
Loans and leases — 5,318 1,620 —6,938
Mortgage servicing rights — — 3,087 —3,087
Loans held-for-sale — 4,031 787 — 4,818
Other assets (4) 11,923 2,023 374 — 14,320
Total assets $ 145,650 $ 1,109,206 $ 18,098 $ (639,751) $ 633,203
Liabilities
Interest-bearing deposits in U.S. offices $ — $ 1,116 $ —$ —$ 1,116
Federal funds purchased and securities loaned or sold under
agreements to repurchase — 24,239 335 — 24,574
Trading account liabilities:
U.S. government and agency securities 14,803 169 ——14,972
Equity securities 27,898 2,392 — —30,290
Non-U.S. sovereign debt 13,589 1,951 — —15,540
Corporate securities and other 193 5,947 21 —6,161
Total trading account liabilities 56,483 10,459 21 —66,963
Derivative liabilities (3) 4,941 671,613 5,575 (643,679) 38,450
Short-term borrowings — 1,295 30 —1,325
Accrued expenses and other liabilities 11,656 2,234 9 —13,899
Long-term debt — 28,584 1,513 —30,097
Total liabilities $ 73,080 $ 739,540 $ 7,483 $ (643,679) $ 176,424
(1) Amounts represent the impact of legally enforceable master netting agreements and also cash collateral held or placed with the same counterparties.
(2) Includes $14.8 billion of government-sponsored enterprise obligations.
(3) During 2015, $6.6 billion of derivative assets and $6.7 billion of derivative liabilities were transferred from Level 1 to Level 2 based on inputs used to measure fair value. Additionally, $6.4 billion
of derivative assets and $6.2 billion of derivative liabilities were transferred from Level 2 to Level 1 due to additional information related to certain options. For further disaggregation of derivative
assets and liabilities, see Note 2 – Derivatives.
(4) During 2015, approximately $327 million of assets were transferred from Level 2 to Level 1 due to a restriction that was lifted for an equity investment.