Bank of America 2015 Annual Report Download - page 29
Download and view the complete annual report
Please find page 29 of the 2015 Bank of America annual report below. You can navigate through the pages in the report by either clicking on the pages listed below, or by using the keyword search tool below to find specific information within the annual report.-
 1
1 -
2
-
3
-
4
-
5
-
6
-
7
-
8
-
9
-
10
-
11
-
12
-
13
-
14
-
15
-
16
-
17
-
18
-
 19
19 -
 20
20 -
 21
21 -
 22
22 -
 23
23 -
 24
24 -
 25
25 -
 26
26 -
 27
27 -
 28
28 -
 29
29 -
 30
30 -
 31
31 -
 32
32 -
 33
33 -
 34
34 -
 35
35 -
 36
36 -
 37
37 -
 38
38 -
 39
39 -
40
-
41
-
42
-
43
-
44
-
45
-
46
-
47
-
48
-
49
-
50
-
51
-
52
-
53
-
54
-
55
-
56
-
57
-
58
-
59
-
60
-
61
-
62
-
63
-
64
-
65
-
66
-
67
-
68
-
69
-
70
-
71
-
72
-
73
-
74
-
75
-
76
-
77
-
78
-
79
-
80
-
81
-
82
-
83
-
84
-
85
-
86
-
87
-
88
-
89
-
90
-
91
-
92
-
93
-
94
-
95
-
96
-
97
-
98
-
99
-
100
-
101
-
102
-
103
-
104
-
105
-
106
-
107
-
108
-
109
-
110
-
111
-
112
-
113
-
114
-
115
-
116
-
117
-
118
-
119
-
120
-
121
-
122
-
123
-
124
-
125
-
126
-
127
-
128
-
129
-
130
-
131
-
132
-
133
-
134
-
135
-
136
-
137
-
138
-
139
-
140
-
141
-
142
-
143
-
144
-
145
-
146
-
147
-
148
-
149
-
150
-
151
-
152
-
153
-
154
-
155
-
156
-
157
-
158
-
159
-
160
-
161
-
162
-
163
-
164
-
165
-
166
-
167
-
168
-
169
-
170
-
171
-
172
-
173
-
174
-
175
-
176
-
177
-
178
-
179
-
180
-
181
-
182
-
183
-
184
-
185
-
186
-
187
-
188
-
189
-
190
-
191
-
192
-
193
-
194
-
195
-
196
-
197
-
198
-
199
-
200
-
201
-
202
-
203
-
204
-
205
-
206
-
207
-
208
-
209
-
210
-
211
-
212
-
213
-
214
-
215
-
216
-
217
-
218
-
219
-
220
-
221
-
222
-
223
-
224
-
225
-
226
-
227
-
228
-
229
-
230
-
231
-
232
-
233
-
234
-
235
-
236
-
237
-
238
-
239
-
240
-
241
-
242
-
243
-
244
-
245
-
246
-
247
-
248
-
249
-
250
-
251
-
252
-
253
-
254
-
255
-
256
 |
 |

Bank of America 2015 27
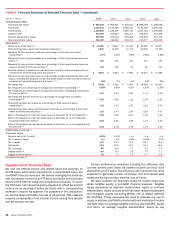
Table 8 Five-year Summary of Selected Financial Data (1)
(In millions, except per share information) 2015 2014 2013 2012 2011
Income statement
Net interest income $ 39,251 $ 39,952 $ 42,265 $ 40,656 $ 44,616
Noninterest income 43,256 44,295 46,677 42,678 48,838
Total revenue, net of interest expense 82,507 84,247 88,942 83,334 93,454
Provision for credit losses 3,161 2,275 3,556 8,169 13,410
Goodwill impairment —— — — 3,184
Merger and restructuring charges —— — — 638
All other noninterest expense 57,192 75,117 69,214 72,093 76,452
Income (loss) before income taxes 22,154 6,855 16,172 3,072 (230)
Income tax expense (benefit) 6,266 2,022 4,741 (1,116) (1,676)
Net income 15,888 4,833 11,431 4,188 1,446
Net income applicable to common shareholders 14,405 3,789 10,082 2,760 85
Average common shares issued and outstanding 10,462 10,528 10,731 10,746 10,143
Average diluted common shares issued and outstanding 11,214 10,585 11,491 10,841 10,255
Performance ratios
Return on average assets 0.74%0.23% 0.53% 0.19% 0.06%
Return on average common shareholders’ equity 6.26 1.70 4.62 1.27 0.04
Return on average tangible common shareholders’ equity (2) 9.11 2.52 6.97 1.94 0.06
Return on average tangible shareholders’ equity (2) 8.83 2.92 7.13 2.60 0.96
Total ending equity to total ending assets 11.95 11.57 11.07 10.72 10.81
Total average equity to total average assets 11.67 11.11 10.81 10.75 9.98
Dividend payout 14.51 33.31 4.25 15.86 n/m
Per common share data
Earnings $1.38 $ 0.36 $ 0.94 $ 0.26 $ 0.01
Diluted earnings 1.31 0.36 0.90 0.25 0.01
Dividends paid 0.20 0.12 0.04 0.04 0.04
Book value 22.54 21.32 20.71 20.24 20.09
Tangible book value (2) 15.62 14.43 13.79 13.36 12.95
Market price per share of common stock
Closing $ 16.83 $ 17.89 $ 15.57 $ 11.61 $ 5.56
High closing 18.45 18.13 15.88 11.61 15.25
Low closing 15.15 14.51 11.03 5.80 4.99
Market capitalization $ 174,700 $ 188,141 $ 164,914 $ 125,136 $ 58,580
(1) The results for 2015 were impacted by the early adoption of new accounting guidance on recognition and measurement of financial instruments. For additional information, see Executive Summary
– Recent Events on page 20.
(2) Tangible equity ratios and tangible book value per share of common stock are non-GAAP financial measures. Other companies may define or calculate these measures differently. For more information
on these ratios, see Supplemental Financial Data on page 28, and for corresponding reconciliations to GAAP financial measures, see Statistical Table XIII on page 121.
(3) For more information on the impact of the purchased credit-impaired (PCI) loan portfolio on asset quality, see Consumer Portfolio Credit Risk Management on page 64.
(4) Includes the allowance for loan and lease losses and the reserve for unfunded lending commitments.
(5) Balances and ratios do not include loans accounted for under the fair value option. For additional exclusions from nonperforming loans, leases and foreclosed properties, see Consumer Portfolio
Credit Risk Management – Nonperforming Consumer Loans, Leases and Foreclosed Properties Activity on page 73 and corresponding Table 35, and Commercial Portfolio Credit Risk Management –
Nonperforming Commercial Loans, Leases and Foreclosed Properties Activity on page 80 and corresponding Table 44.
(6) Primarily includes amounts allocated to the U.S. credit card and unsecured consumer lending portfolios in Consumer Banking, PCI loans and the non-U.S. credit card portfolio in All Other.
(7) Net charge-offs exclude $808 million, $810 million and $2.3 billion of write-offs in the PCI loan portfolio for 2015, 2014 and 2013, respectively. For more information on PCI write-offs, see Consumer
Portfolio Credit Risk Management – Purchased Credit-impaired Loan Portfolio on page 71.
(8) There were no write-offs of PCI loans in 2011.
(9) Capital ratios reported under Advanced approaches at December 31, 2015. Prior to 2015, we were required to report regulatory capital ratios under the Standardized approach only. For additional
information, see Capital Management on page 51.
n/a = not applicable
n/m = not meaningful