Bank of America 2015 Annual Report Download - page 163
Download and view the complete annual report
Please find page 163 of the 2015 Bank of America annual report below. You can navigate through the pages in the report by either clicking on the pages listed below, or by using the keyword search tool below to find specific information within the annual report.-
 1
1 -
2
-
3
-
4
-
5
-
6
-
7
-
8
-
9
-
10
-
11
-
12
-
13
-
14
-
15
-
16
-
17
-
18
-
19
-
20
-
21
-
22
-
23
-
24
-
25
-
26
-
27
-
28
-
29
-
30
-
31
-
32
-
33
-
34
-
35
-
36
-
37
-
38
-
39
-
40
-
41
-
42
-
43
-
44
-
45
-
46
-
47
-
48
-
49
-
50
-
51
-
52
-
53
-
54
-
55
-
56
-
57
-
58
-
59
-
60
-
61
-
62
-
63
-
64
-
65
-
66
-
67
-
68
-
69
-
70
-
71
-
72
-
73
-
74
-
75
-
76
-
77
-
78
-
79
-
80
-
81
-
82
-
83
-
84
-
85
-
86
-
87
-
88
-
89
-
90
-
91
-
92
-
93
-
94
-
95
-
96
-
97
-
98
-
99
-
100
-
101
-
102
-
103
-
104
-
105
-
106
-
107
-
108
-
109
-
110
-
111
-
112
-
113
-
114
-
115
-
116
-
117
-
118
-
119
-
120
-
121
-
122
-
123
-
124
-
125
-
126
-
127
-
128
-
129
-
130
-
131
-
132
-
133
-
134
-
135
-
136
-
137
-
138
-
139
-
140
-
141
-
142
-
143
-
144
-
145
-
146
-
147
-
148
-
149
-
150
-
151
-
152
-
 153
153 -
 154
154 -
 155
155 -
 156
156 -
 157
157 -
 158
158 -
 159
159 -
 160
160 -
 161
161 -
 162
162 -
 163
163 -
 164
164 -
 165
165 -
 166
166 -
 167
167 -
 168
168 -
 169
169 -
 170
170 -
 171
171 -
 172
172 -
 173
173 -
174
-
175
-
176
-
177
-
178
-
179
-
180
-
181
-
182
-
183
-
184
-
185
-
186
-
187
-
188
-
189
-
190
-
191
-
192
-
193
-
194
-
195
-
196
-
197
-
198
-
199
-
200
-
201
-
202
-
203
-
204
-
205
-
206
-
207
-
208
-
209
-
210
-
211
-
212
-
213
-
214
-
215
-
216
-
217
-
218
-
219
-
220
-
221
-
222
-
223
-
224
-
225
-
226
-
227
-
228
-
229
-
230
-
231
-
232
-
233
-
234
-
235
-
236
-
237
-
238
-
239
-
240
-
241
-
242
-
243
-
244
-
245
-
246
-
247
-
248
-
249
-
250
-
251
-
252
-
253
-
254
-
255
-
256
 |
 |

Bank of America 2015 161
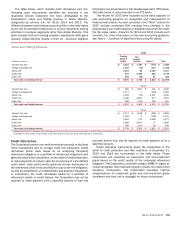
The expected maturity distribution and yields of the Corporation’s debt securities carried at fair value and HTM debt securities at
December 31, 2015 are summarized in the table below. Actual maturities may differ from the contractual or expected maturities since
borrowers may have the right to prepay obligations with or without prepayment penalties.
Maturities of Debt Securities Carried at Fair Value and Held-to-maturity Debt Securities
December 31, 2015
Due in One
Year or Less
Due after One Year
through Five Years
Due after Five Years
through Ten Years
Due after
Ten Years Total
(Dollars in millions) Amount Yield (1) Amount Yield (1) Amount Yield (1) Amount Yield (1) Amount Yield (1)
Amortized cost of debt securities carried at fair value
Mortgage-backed securities:
Agency $ 57 4.40% $ 28,943 2.40% $197,797 2.80% $ 3,050 2.90% $229,847 2.75%
Agency-collateralized mortgage obligations 157 1.10 3,077 2.20 7,702 2.80 ——
10,936 2.61
Commercial 205 2.16 615 2.10 6,356 2.70 — — 7,176 2.63
Non-agency residential 320 5.00 1,123 4.99 1,165 4.18 3,989 7.90 6,597 6.60
Total mortgage-backed securities 739 3.31 33,758 2.46 213,020 2.80 7,039 5.73 254,556 3.03
U.S. Treasury and agency securities 516 0.19 23,103 1.70 1,454 3.14 2 4.57 25,075 1.75
Non-U.S. securities 16,707 0.82 1,864 3.08 6 2.79 ——
18,577 1.04
Corporate/Agency bonds 40 3.97 69 4.20 131 3.41 3 3.67 243 3.93
Other taxable securities, substantially all asset-backed
securities 2,918 1.11 4,596 1.28 2,268 2.38 728 3.96 10,510 1.67
Total taxable securities 20,920 0.94 63,390 2.13 216,879 2.81 7,772 5.57 308,961 2.61
Tax-exempt securities 836 1.27 5,127 1.31 5,879 1.35 2,136 1.55 13,978 1.36
Total amortized cost of debt securities carried at fair
value $ 21,756 0.95 $ 68,517 2.06 $ 222,758 2.77 $ 9,908 4.70 $ 322,939 2.56
Amortized cost of HTM debt securities (2) $ 568 0.01 $ 18,325 2.30 $ 62,978 2.50 $ 2,754 2.82 $ 84,625 2.45
Debt securities carried at fair value
Mortgage-backed securities:
Agency $ 59 $ 29,150 $196,720 $ 3,018 $228,947
Agency-collateralized mortgage obligations 157 3,056 7,779 — 10,992
Commercial 223 618 6,324 — 7,165
Non-agency residential 354 1,102 1,263 3,950 6,669
Total mortgage-backed securities 793 33,926 212,086 6,968 253,773
U.S. Treasury and agency securities 516 23,266 1,493 2 25,277
Non-U.S. securities 16,720 1,884 6 — 18,610
Corporate/Agency bonds 41 70 128 4 243
Other taxable securities, substantially all asset-backed
securities 3,102 4,349 2,296 722 10,469
Total taxable securities 21,172 63,495 216,009 7,696 308,372
Tax-exempt securities 836 5,161 5,882 2,129 14,008
Total debt securities carried at fair value $ 22,008 $ 68,656 $ 221,891 $ 9,825 $ 322,380
Fair value of HTM debt securities (2) $ 569 $ 18,356 $ 62,360 $ 2,761 $ 84,046
(1) Average yield is computed using the effective yield of each security at the end of the period, weighted based on the amortized cost of each security. The effective yield considers the contractual
coupon, amortization of premiums and accretion of discounts, and excludes the effect of related hedging derivatives.
(2) Substantially all U.S. agency MBS.
Certain Corporate and Strategic Investments
The Corporation’s 49 percent investment in a merchant services
joint venture, which is recorded in other assets on the Consolidated
Balance Sheet and in All Other, had a carrying value of $3.0 billion
and $3.1 billion at December 31, 2015 and 2014. For additional
information, see Note 12 – Commitments and Contingencies.
In 2013, the Corporation sold its remaining investment in China
Construction Bank Corporation (CCB) and realized a pretax gain
of $753 million in All Other reported in equity investment income
in the Consolidated Statement of Income. The strategic assistance
agreement between the Corporation and CCB, which includes
cooperation in specific business areas, extends through 2016.
The Corporation holds investments in partnerships that
construct, own and operate real estate projects that qualify for low
income housing tax credits. The Corporation earns a return
primarily through the receipt of tax credits allocated to the real
estate projects.
Total low income housing tax credit investments were $7.1
billion and $6.6 billion at December 31, 2015 and 2014. These
investments are reported in other assets on the Consolidated
Balance Sheet. The Corporation had unfunded commitments to
provide capital contributions of $2.4 billion and $2.2 billion to
these partnerships at December 31, 2015 and 2014, which are
expected to be paid over the next five years. These commitments
are reported in accrued expenses and other liabilities on the
Consolidated Balance Sheet. During 2015 and 2014, the
Corporation recognized tax credits and other tax benefits from
investments in affordable housing partnerships of $928 million
and $920 million, partially offset by pretax losses recognized in
other income of $629 million and $601 million.