Bank of America 2015 Annual Report Download - page 249
Download and view the complete annual report
Please find page 249 of the 2015 Bank of America annual report below. You can navigate through the pages in the report by either clicking on the pages listed below, or by using the keyword search tool below to find specific information within the annual report.-
 1
1 -
2
-
3
-
4
-
5
-
6
-
7
-
8
-
9
-
10
-
11
-
12
-
13
-
14
-
15
-
16
-
17
-
18
-
19
-
20
-
21
-
22
-
23
-
24
-
25
-
26
-
27
-
28
-
29
-
30
-
31
-
32
-
33
-
34
-
35
-
36
-
37
-
38
-
39
-
40
-
41
-
42
-
43
-
44
-
45
-
46
-
47
-
48
-
49
-
50
-
51
-
52
-
53
-
54
-
55
-
56
-
57
-
58
-
59
-
60
-
61
-
62
-
63
-
64
-
65
-
66
-
67
-
68
-
69
-
70
-
71
-
72
-
73
-
74
-
75
-
76
-
77
-
78
-
79
-
80
-
81
-
82
-
83
-
84
-
85
-
86
-
87
-
88
-
89
-
90
-
91
-
92
-
93
-
94
-
95
-
96
-
97
-
98
-
99
-
100
-
101
-
102
-
103
-
104
-
105
-
106
-
107
-
108
-
109
-
110
-
111
-
112
-
113
-
114
-
115
-
116
-
117
-
118
-
119
-
120
-
121
-
122
-
123
-
124
-
125
-
126
-
127
-
128
-
129
-
130
-
131
-
132
-
133
-
134
-
135
-
136
-
137
-
138
-
139
-
140
-
141
-
142
-
143
-
144
-
145
-
146
-
147
-
148
-
149
-
150
-
151
-
152
-
153
-
154
-
155
-
156
-
157
-
158
-
159
-
160
-
161
-
162
-
163
-
164
-
165
-
166
-
167
-
168
-
169
-
170
-
171
-
172
-
173
-
174
-
175
-
176
-
177
-
178
-
179
-
180
-
181
-
182
-
183
-
184
-
185
-
186
-
187
-
188
-
189
-
190
-
191
-
192
-
193
-
194
-
195
-
196
-
197
-
198
-
199
-
200
-
201
-
202
-
203
-
204
-
205
-
206
-
207
-
208
-
209
-
210
-
211
-
212
-
213
-
214
-
215
-
216
-
217
-
218
-
219
-
220
-
221
-
222
-
223
-
224
-
225
-
226
-
227
-
228
-
229
-
230
-
231
-
232
-
233
-
234
-
235
-
236
-
237
-
238
-
 239
239 -
 240
240 -
 241
241 -
 242
242 -
 243
243 -
 244
244 -
 245
245 -
 246
246 -
 247
247 -
 248
248 -
 249
249 -
 250
250 -
 251
251 -
 252
252 -
 253
253 -
 254
254 -
 255
255 -
 256
256
 |
 |

Bank of America 2015 247
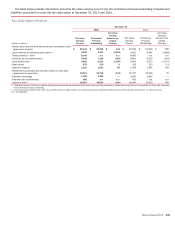
NOTE 25 Parent Company Information
The following tables present the Parent Company-only financial information. This financial information is presented in accordance with
bank regulatory reporting requirements.
Condensed Statement of Income
(Dollars in millions) 2015 2014 2013
Income
Dividends from subsidiaries:
Bank holding companies and related subsidiaries $ 18,970 $ 12,400 $ 8,532
Nonbank companies and related subsidiaries 53 149 357
Interest from subsidiaries 2,004 1,836 2,087
Other income (loss) (623)72 233
Total income 20,404 14,457 11,209
Expense
Interest on borrowed funds from related subsidiaries 1,169 1,661 1,730
Other interest expense 5,098 5,552 6,379
Noninterest expense 4,747 4,471 10,938
Total expense 11,014 11,684 19,047
Income (loss) before income taxes and equity in undistributed earnings of subsidiaries 9,390 2,773 (7,838)
Income tax benefit (3,574)(4,079) (7,227)
Income (loss) before equity in undistributed earnings of subsidiaries 12,964 6,852 (611)
Equity in undistributed earnings (losses) of subsidiaries:
Bank holding companies and related subsidiaries 3,120 3,613 14,150
Nonbank companies and related subsidiaries (196)(5,632) (2,108)
Total equity in undistributed earnings (losses) of subsidiaries 2,924 (2,019) 12,042
Net income $ 15,888 $ 4,833 $ 11,431
Condensed Balance Sheet
December 31
(Dollars in millions) 2015 2014
Assets
Cash held at bank subsidiaries (1) $98,024 $ 100,304
Securities 937 932
Receivables from subsidiaries:
Bank holding companies and related subsidiaries 23,594 23,356
Banks and related subsidiaries 569 2,395
Nonbank companies and related subsidiaries 56,426 52,251
Investments in subsidiaries:
Bank holding companies and related subsidiaries 272,596 270,441
Nonbank companies and related subsidiaries 2,402 2,139
Other assets 9,360 14,599
Total assets $ 463,908 $ 466,417
Liabilities and shareholders’ equity
Short-term borrowings $15 $ 46
Accrued expenses and other liabilities 13,900 16,872
Payables to subsidiaries:
Banks and related subsidiaries 465 2,559
Nonbank companies and related subsidiaries 13,921 17,698
Long-term debt 179,402 185,771
Total liabilities 207,703 222,946
Shareholders’ equity 256,205 243,471
Total liabilities and shareholders’ equity $ 463,908 $ 466,417
(1) Balance includes third-party cash held of $28 million and $29 million at December 31, 2015 and 2014.