Bank of America 2015 Annual Report Download - page 30
Download and view the complete annual report
Please find page 30 of the 2015 Bank of America annual report below. You can navigate through the pages in the report by either clicking on the pages listed below, or by using the keyword search tool below to find specific information within the annual report.-
 1
1 -
2
-
3
-
4
-
5
-
6
-
7
-
8
-
9
-
10
-
11
-
12
-
13
-
14
-
15
-
16
-
17
-
18
-
19
-
 20
20 -
 21
21 -
 22
22 -
 23
23 -
 24
24 -
 25
25 -
 26
26 -
 27
27 -
 28
28 -
 29
29 -
 30
30 -
 31
31 -
 32
32 -
 33
33 -
 34
34 -
 35
35 -
 36
36 -
 37
37 -
 38
38 -
 39
39 -
 40
40 -
41
-
42
-
43
-
44
-
45
-
46
-
47
-
48
-
49
-
50
-
51
-
52
-
53
-
54
-
55
-
56
-
57
-
58
-
59
-
60
-
61
-
62
-
63
-
64
-
65
-
66
-
67
-
68
-
69
-
70
-
71
-
72
-
73
-
74
-
75
-
76
-
77
-
78
-
79
-
80
-
81
-
82
-
83
-
84
-
85
-
86
-
87
-
88
-
89
-
90
-
91
-
92
-
93
-
94
-
95
-
96
-
97
-
98
-
99
-
100
-
101
-
102
-
103
-
104
-
105
-
106
-
107
-
108
-
109
-
110
-
111
-
112
-
113
-
114
-
115
-
116
-
117
-
118
-
119
-
120
-
121
-
122
-
123
-
124
-
125
-
126
-
127
-
128
-
129
-
130
-
131
-
132
-
133
-
134
-
135
-
136
-
137
-
138
-
139
-
140
-
141
-
142
-
143
-
144
-
145
-
146
-
147
-
148
-
149
-
150
-
151
-
152
-
153
-
154
-
155
-
156
-
157
-
158
-
159
-
160
-
161
-
162
-
163
-
164
-
165
-
166
-
167
-
168
-
169
-
170
-
171
-
172
-
173
-
174
-
175
-
176
-
177
-
178
-
179
-
180
-
181
-
182
-
183
-
184
-
185
-
186
-
187
-
188
-
189
-
190
-
191
-
192
-
193
-
194
-
195
-
196
-
197
-
198
-
199
-
200
-
201
-
202
-
203
-
204
-
205
-
206
-
207
-
208
-
209
-
210
-
211
-
212
-
213
-
214
-
215
-
216
-
217
-
218
-
219
-
220
-
221
-
222
-
223
-
224
-
225
-
226
-
227
-
228
-
229
-
230
-
231
-
232
-
233
-
234
-
235
-
236
-
237
-
238
-
239
-
240
-
241
-
242
-
243
-
244
-
245
-
246
-
247
-
248
-
249
-
250
-
251
-
252
-
253
-
254
-
255
-
256
 |
 |

28 Bank of America 2015
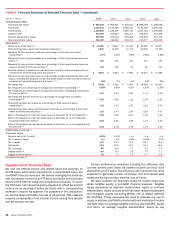
Table 8 Five-year Summary of Selected Financial Data (1) (continued)
(Dollars in millions) 2015 2014 2013 2012 2011
Average balance sheet
Total loans and leases $ 882,183 $ 903,901 $ 918,641 $ 898,768 $ 938,096
Total assets 2,160,141 2,145,590 2,163,513 2,191,356 2,296,322
Total deposits 1,155,860 1,124,207 1,089,735 1,047,782 1,035,802
Long-term debt 240,059 253,607 263,417 316,393 421,229
Common shareholders’ equity 230,182 223,072 218,468 216,996 211,709
Total shareholders’ equity 251,990 238,482 233,951 235,677 229,095
Asset quality (3)
Allowance for credit losses (4) $ 12,880 $ 14,947 $ 17,912 $ 24,692 $ 34,497
Nonperforming loans, leases and foreclosed properties (5) 9,836 12,629 17,772 23,555 27,708
Allowance for loan and lease losses as a percentage of total loans and leases
outstanding (5) 1.37%1.65% 1.90% 2.69% 3.68%
Allowance for loan and lease losses as a percentage of total nonperforming loans and
leases (5) 130 121 102 107 135
Allowance for loan and lease losses as a percentage of total nonperforming loans and
leases, excluding the PCI loan portfolio (5) 122 107 87 82 101
Amounts included in allowance for loan and lease losses for loans and leases that are
excluded from nonperforming loans and leases (6) $ 4,518 $ 5,944 $ 7,680 $ 12,021 $ 17,490
Allowance for loan and lease losses as a percentage of total nonperforming loans and
leases, excluding the allowance for loan and lease losses for loans and leases that are
excluded from nonperforming loans and leases (5, 6) 82% 71% 57% 54% 65%
Net charge-offs (7) $ 4,338 $ 4,383 $ 7,897 $ 14,908 $ 20,833
Net charge-offs as a percentage of average loans and leases outstanding (5, 7) 0.50%0.49% 0.87% 1.67% 2.24%
Net charge-offs as a percentage of average loans and leases outstanding, excluding the
PCI loan portfolio (5) 0.51 0.50 0.90 1.73 2.32
Net charge-offs and PCI write-offs as a percentage of average loans and leases
outstanding (5, 8) 0.59 0.58 1.13 1.99 2.24
Nonperforming loans and leases as a percentage of total loans and leases
outstanding (5) 1.05 1.37 1.87 2.52 2.74
Nonperforming loans, leases and foreclosed properties as a percentage of total loans,
leases and foreclosed properties (5) 1.10 1.45 1.93 2.62 3.01
Ratio of the allowance for loan and lease losses at December 31 to net charge-offs (7) 2.82 3.29 2.21 1.62 1.62
Ratio of the allowance for loan and lease losses at December 31 to net charge-offs,
excluding the PCI loan portfolio 2.64 2.91 1.89 1.25 1.22
Ratio of the allowance for loan and lease losses at December 31 to net charge-offs and
PCI write-offs (8) 2.38 2.78 1.70 1.36 1.62
Capital ratios at year end (9)
Risk-based capital:
Common equity tier 1 capital 10.2%12.3% n/a n/a n/a
Tier 1 common capital n/a n/a 10.9% 10.8% 9.7%
Tier 1 capital 11.3 13.4 12.2 12.7 12.2
Total capital 13.2 16.5 15.1 16.1 16.6
Tier 1 leverage 8.6 8.2 7.7 7.2 7.4
Tangible equity (2) 8.9 8.4 7.9 7.6 7.5
Tangible common equity (2) 7.8 7.5 7.2 6.7 6.6
For footnotes see page 27.
Supplemental Financial Data
We view net interest income and related ratios and analyses on
an FTE basis, which when presented on a consolidated basis, are
non-GAAP financial measures. We believe managing the business
with net interest income on an FTE basis provides a more accurate
picture of the interest margin for comparative purposes. To derive
the FTE basis, net interest income is adjusted to reflect tax-exempt
income on an equivalent before-tax basis with a corresponding
increase in income tax expense. For purposes of this calculation,
we use the federal statutory tax rate of 35 percent. This measure
ensures comparability of net interest income arising from taxable
and tax-exempt sources.
Certain performance measures including the efficiency ratio
and net interest yield utilize net interest income (and thus total
revenue) on an FTE basis. The efficiency ratio measures the costs
expended to generate a dollar of revenue, and net interest yield
measures the bps we earn over the cost of funds.
We also evaluate our business based on certain ratios that
utilize tangible equity, a non-GAAP financial measure. Tangible
equity represents an adjusted shareholders’ equity or common
shareholders’ equity amount which has been reduced by goodwill
and intangible assets (excluding MSRs), net of related deferred
tax liabilities. These measures are used to evaluate our use of
equity. In addition, profitability, relationship and investment models
use both return on average tangible common shareholders’ equity
and return on average tangible shareholders’ equity as key