Bank of America 2015 Annual Report Download - page 165
Download and view the complete annual report
Please find page 165 of the 2015 Bank of America annual report below. You can navigate through the pages in the report by either clicking on the pages listed below, or by using the keyword search tool below to find specific information within the annual report.-
 1
1 -
2
-
3
-
4
-
5
-
6
-
7
-
8
-
9
-
10
-
11
-
12
-
13
-
14
-
15
-
16
-
17
-
18
-
19
-
20
-
21
-
22
-
23
-
24
-
25
-
26
-
27
-
28
-
29
-
30
-
31
-
32
-
33
-
34
-
35
-
36
-
37
-
38
-
39
-
40
-
41
-
42
-
43
-
44
-
45
-
46
-
47
-
48
-
49
-
50
-
51
-
52
-
53
-
54
-
55
-
56
-
57
-
58
-
59
-
60
-
61
-
62
-
63
-
64
-
65
-
66
-
67
-
68
-
69
-
70
-
71
-
72
-
73
-
74
-
75
-
76
-
77
-
78
-
79
-
80
-
81
-
82
-
83
-
84
-
85
-
86
-
87
-
88
-
89
-
90
-
91
-
92
-
93
-
94
-
95
-
96
-
97
-
98
-
99
-
100
-
101
-
102
-
103
-
104
-
105
-
106
-
107
-
108
-
109
-
110
-
111
-
112
-
113
-
114
-
115
-
116
-
117
-
118
-
119
-
120
-
121
-
122
-
123
-
124
-
125
-
126
-
127
-
128
-
129
-
130
-
131
-
132
-
133
-
134
-
135
-
136
-
137
-
138
-
139
-
140
-
141
-
142
-
143
-
144
-
145
-
146
-
147
-
148
-
149
-
150
-
151
-
152
-
153
-
154
-
 155
155 -
 156
156 -
 157
157 -
 158
158 -
 159
159 -
 160
160 -
 161
161 -
 162
162 -
 163
163 -
 164
164 -
 165
165 -
 166
166 -
 167
167 -
 168
168 -
 169
169 -
 170
170 -
 171
171 -
 172
172 -
 173
173 -
 174
174 -
 175
175 -
176
-
177
-
178
-
179
-
180
-
181
-
182
-
183
-
184
-
185
-
186
-
187
-
188
-
189
-
190
-
191
-
192
-
193
-
194
-
195
-
196
-
197
-
198
-
199
-
200
-
201
-
202
-
203
-
204
-
205
-
206
-
207
-
208
-
209
-
210
-
211
-
212
-
213
-
214
-
215
-
216
-
217
-
218
-
219
-
220
-
221
-
222
-
223
-
224
-
225
-
226
-
227
-
228
-
229
-
230
-
231
-
232
-
233
-
234
-
235
-
236
-
237
-
238
-
239
-
240
-
241
-
242
-
243
-
244
-
245
-
246
-
247
-
248
-
249
-
250
-
251
-
252
-
253
-
254
-
255
-
256
 |
 |

Bank of America 2015 163
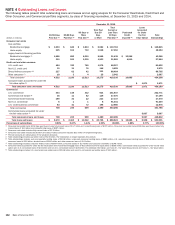
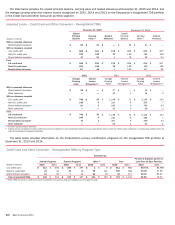
December 31, 2014
(Dollars in millions)
30-59 Days
Past Due (1)
60-89 Days
Past Due (1)
90 Days or
More
Past Due (2)
Total Past
Due 30
Days
or More
Total
Current or
Less Than
30 Days
Past Due (3)
Purchased
Credit-
impaired (4)
Loans
Accounted
for Under
the Fair
Value Option
Total
Outstandings
Consumer real estate
Core portfolio
Residential mortgage $ 1,847 $ 700 $ 5,561 $ 8,108 $ 154,112 $ 162,220
Home equity 218 105 744 1,067 50,820 51,887
Legacy Assets & Servicing portfolio
Residential mortgage (5) 2,008 1,060 10,513 13,581 25,244 $ 15,152 53,977
Home equity 374 174 1,166 1,714 26,507 5,617 33,838
Credit card and other consumer
U.S. credit card 494 341 866 1,701 90,178 91,879
Non-U.S. credit card 49 39 95 183 10,282 10,465
Direct/Indirect consumer (6) 245 71 65 381 80,000 80,381
Other consumer (7) 11 2 2 15 1,831 1,846
Total consumer 5,246 2,492 19,012 26,750 438,974 20,769 486,493
Consumer loans accounted for under the
fair value option (8) $ 2,077 2,077
Total consumer loans and leases 5,246 2,492 19,012 26,750 438,974 20,769 2,077 488,570
Commercial
U.S. commercial 320 151 318 789 219,504 220,293
Commercial real estate (9) 138 16 288 442 47,240 47,682
Commercial lease financing 121 41 42 204 24,662 24,866
Non-U.S. commercial 5 4 — 9 80,074 80,083
U.S. small business commercial 88 45 94 227 13,066 13,293
Total commercial 672 257 742 1,671 384,546 386,217
Commercial loans accounted for under
the fair value option (8) 6,604 6,604
Total commercial loans and leases 672 257 742 1,671 384,546 6,604 392,821
Total loans and leases $ 5,918 $ 2,749 $ 19,754 $ 28,421 $ 823,520 $ 20,769 $ 8,681 $ 881,391
Percentage of outstandings 0.67% 0.31% 2.24% 3.22% 93.44% 2.36% 0.98% 100.00%
(1) Consumer real estate loans 30-59 days past due includes fully-insured loans of $2.1 billion and nonperforming loans of $392 million. Consumer real estate loans 60-89 days past due includes fully-
insured loans of $1.1 billion and nonperforming loans of $332 million.
(2) Consumer real estate includes fully-insured loans of $11.4 billion.
(3) Consumer real estate includes $3.6 billion and direct/indirect consumer includes $27 million of nonperforming loans.
(4) PCI loan amounts are shown gross of the valuation allowance.
(5) Total outstandings includes pay option loans of $3.2 billion. The Corporation no longer originates this product.
(6) Total outstandings includes auto and specialty lending loans of $37.7 billion, unsecured consumer lending loans of $1.5 billion, U.S. securities-based lending loans of $35.8 billion, non-U.S. consumer
loans of $4.0 billion, student loans of $632 million and other consumer loans of $761 million.
(7) Total outstandings includes consumer finance loans of $676 million, consumer leases of $1.0 billion and consumer overdrafts of $162 million.
(8) Consumer loans accounted for under the fair value option were residential mortgage loans of $1.9 billion and home equity loans of $196 million. Commercial loans accounted for under the fair value
option were U.S. commercial loans of $1.9 billion and non-U.S. commercial loans of $4.7 billion. For additional information, see Note 20 – Fair Value Measurements and Note 21 – Fair Value Option.
(9) Total outstandings includes U.S. commercial real estate loans of $45.2 billion and non-U.S. commercial real estate loans of $2.5 billion.
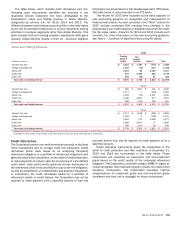
The Corporation has entered into long-term credit protection
agreements with FNMA and FHLMC on loans totaling $3.7 billion
and $17.2 billion at December 31, 2015 and 2014, providing full
credit protection on residential mortgage loans that become
severely delinquent. All of these loans are individually insured and
therefore the Corporation does not record an allowance for credit
losses related to these loans.
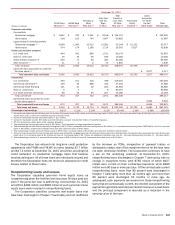
Nonperforming Loans and Leases
The Corporation classifies junior-lien home equity loans as
nonperforming when the first-lien loan becomes 90 days past due
even if the junior-lien loan is performing. At December 31, 2015
and 2014, $484 million and $800 million of such junior-lien home
equity loans were included in nonperforming loans.
The Corporation classifies consumer real estate loans that
have been discharged in Chapter 7 bankruptcy and not reaffirmed
by the borrower as TDRs, irrespective of payment history or
delinquency status, even if the repayment terms for the loan have
not been otherwise modified. The Corporation continues to have
a lien on the underlying collateral. At December 31, 2015,
nonperforming loans discharged in Chapter 7 bankruptcy with no
change in repayment terms were $785 million of which $457
million were current on their contractual payments, while $285
million were 90 days or more past due. Of the contractually current
nonperforming loans, more than 80 percent were discharged in
Chapter 7 bankruptcy more than 12 months ago, and more than
60 percent were discharged 24 months or more ago. As
subsequent cash payments are received on these nonperforming
loans that are contractually current, the interest component of the
payments is generally recorded as interest income on a cash basis
and the principal component is recorded as a reduction in the
carrying value of the loan.