Bank of America 2015 Annual Report Download - page 24
Download and view the complete annual report
Please find page 24 of the 2015 Bank of America annual report below. You can navigate through the pages in the report by either clicking on the pages listed below, or by using the keyword search tool below to find specific information within the annual report.-
 1
1 -
2
-
3
-
4
-
5
-
6
-
7
-
8
-
9
-
10
-
11
-
12
-
13
-
 14
14 -
 15
15 -
 16
16 -
 17
17 -
 18
18 -
 19
19 -
 20
20 -
 21
21 -
 22
22 -
 23
23 -
 24
24 -
 25
25 -
 26
26 -
 27
27 -
 28
28 -
 29
29 -
 30
30 -
 31
31 -
 32
32 -
 33
33 -
 34
34 -
35
-
36
-
37
-
38
-
39
-
40
-
41
-
42
-
43
-
44
-
45
-
46
-
47
-
48
-
49
-
50
-
51
-
52
-
53
-
54
-
55
-
56
-
57
-
58
-
59
-
60
-
61
-
62
-
63
-
64
-
65
-
66
-
67
-
68
-
69
-
70
-
71
-
72
-
73
-
74
-
75
-
76
-
77
-
78
-
79
-
80
-
81
-
82
-
83
-
84
-
85
-
86
-
87
-
88
-
89
-
90
-
91
-
92
-
93
-
94
-
95
-
96
-
97
-
98
-
99
-
100
-
101
-
102
-
103
-
104
-
105
-
106
-
107
-
108
-
109
-
110
-
111
-
112
-
113
-
114
-
115
-
116
-
117
-
118
-
119
-
120
-
121
-
122
-
123
-
124
-
125
-
126
-
127
-
128
-
129
-
130
-
131
-
132
-
133
-
134
-
135
-
136
-
137
-
138
-
139
-
140
-
141
-
142
-
143
-
144
-
145
-
146
-
147
-
148
-
149
-
150
-
151
-
152
-
153
-
154
-
155
-
156
-
157
-
158
-
159
-
160
-
161
-
162
-
163
-
164
-
165
-
166
-
167
-
168
-
169
-
170
-
171
-
172
-
173
-
174
-
175
-
176
-
177
-
178
-
179
-
180
-
181
-
182
-
183
-
184
-
185
-
186
-
187
-
188
-
189
-
190
-
191
-
192
-
193
-
194
-
195
-
196
-
197
-
198
-
199
-
200
-
201
-
202
-
203
-
204
-
205
-
206
-
207
-
208
-
209
-
210
-
211
-
212
-
213
-
214
-
215
-
216
-
217
-
218
-
219
-
220
-
221
-
222
-
223
-
224
-
225
-
226
-
227
-
228
-
229
-
230
-
231
-
232
-
233
-
234
-
235
-
236
-
237
-
238
-
239
-
240
-
241
-
242
-
243
-
244
-
245
-
246
-
247
-
248
-
249
-
250
-
251
-
252
-
253
-
254
-
255
-
256
 |
 |

22 Bank of America 2015
Financial Highlights
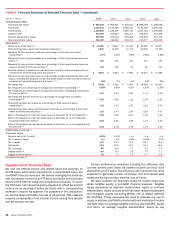
Net income was $15.9 billion, or $1.31 per diluted share in 2015
compared to $4.8 billion, or $0.36 per diluted share in 2014. The
results for 2015 compared to 2014 were primarily driven by a
decrease of $15.2 billion in litigation expense, as well as
decreases in all other noninterest expense categories, partially
offset by a decline in net interest income on a fully taxable-
equivalent (FTE) basis, higher provision for credit losses and lower
revenue. Included in net interest income on an FTE basis was a
charge related to the discount on certain trust preferred securities
of $612 million in 2015, as well as a negative market-related
adjustment on debt securities of $296 million compared to a
negative market-related adjustment of $1.1 billion in 2014.
Total assets increased $39.8 billion from December 31, 2014
to $2.1 trillion at December 31, 2015 primarily driven by an
increase in debt securities due to the deployment of deposit
inflows, an increase in loans driven by strong demand for
commercial loans outpacing consumer loan sales and run-off, and
higher cash and cash equivalents from strong deposit inflows.
Total liabilities increased $27.0 billion from December 31, 2014
to $1.9 trillion at December 31, 2015 primarily driven by an
increase in deposits, partially offset by declines in securities
loaned or sold under agreements to repurchase, trading account
liabilities and long-term debt. During 2015, we returned $5.9 billion
in capital to shareholders through common and preferred stock
dividends and share repurchases. For more information on the
balance sheet, see Executive Summary – Balance Sheet Overview
on page 25.
From a capital management perspective, during 2015, we
maintained our strong capital position with Common equity tier 1
capital of $163.0 billion, risk-weighted assets of $1,602 billion
and a Common equity tier 1 capital ratio of 10.2 percent at
December 31, 2015 as measured under the Basel 3 Advanced –
Transition. On September 3, 2015, we received approval to exit
parallel run and begin using the Basel 3 Advanced approaches
capital framework to determine risk-based capital requirements in
the fourth quarter of 2015. The Corporation’s transitional
supplementary leverage ratio (SLR) was 6.6 percent and 6.2
percent at December 31, 2015 and 2014, both above the 5.0
percent required minimum. Our Global Excess Liquidity Sources
were $504 billion with time-to-required funding at 39 months at
December 31, 2015 compared to $439 billion and 39 months at
December 31, 2014. For additional information, see Capital
Management on page 51 and Liquidity Risk on page 58.
Table 2 Summary Income Statement
(Dollars in millions) 2015 2014
Net interest income (FTE basis) (1) $ 40,160 $ 40,821
Noninterest income 43,256 44,295
Total revenue, net of interest expense (FTE basis) (1) 83,416 85,116
Provision for credit losses 3,161 2,275
Noninterest expense 57,192 75,117
Income before income taxes (FTE basis) (1) 23,063 7,724
Income tax expense (FTE basis) (1) 7,175 2,891
Net income 15,888 4,833
Preferred stock dividends 1,483 1,044
Net income applicable to common shareholders $ 14,405 $ 3,789
Per common share information
Earnings $ 1.38 $ 0.36
Diluted earnings 1.31 0.36
(1) FTE basis is a non-GAAP financial measure. For more information on this measure, see
Supplemental Financial Data on page 28, and for a corresponding reconciliation to GAAP financial
measures, see Statistical Table XIII.
Net Interest Income
Net interest income on an FTE basis decreased $661 million to
$40.2 billion in 2015 compared to 2014. The net interest yield
on an FTE basis decreased five bps to 2.20 percent for 2015.
These declines were primarily driven by lower loan yields and
consumer loan balances, as well as a charge of $612 million in
2015 related to the discount on certain trust preferred securities,
partially offset by a $785 million improvement in market-related
adjustments on debt securities, lower funding costs, higher trading-
related net interest income, lower rates paid on deposits and
commercial loan growth. Market-related adjustments on debt
securities resulted in an expense of $296 million in 2015
compared to an expense of $1.1 billion in 2014. Negative market-
related adjustments on debt securities were primarily due to the
acceleration of premium amortization on debt securities as the
decline in long-term interest rates shortened the estimated lives
of mortgage-related debt securities. Also included in market-
related adjustments is hedge ineffectiveness that impacted net
interest income. For additional information, see Note 1 – Summary
of Significant Accounting Principles to the Consolidated Financial
Statements.