Bank of America 2015 Annual Report Download - page 212
Download and view the complete annual report
Please find page 212 of the 2015 Bank of America annual report below. You can navigate through the pages in the report by either clicking on the pages listed below, or by using the keyword search tool below to find specific information within the annual report.-
 1
1 -
2
-
3
-
4
-
5
-
6
-
7
-
8
-
9
-
10
-
11
-
12
-
13
-
14
-
15
-
16
-
17
-
18
-
19
-
20
-
21
-
22
-
23
-
24
-
25
-
26
-
27
-
28
-
29
-
30
-
31
-
32
-
33
-
34
-
35
-
36
-
37
-
38
-
39
-
40
-
41
-
42
-
43
-
44
-
45
-
46
-
47
-
48
-
49
-
50
-
51
-
52
-
53
-
54
-
55
-
56
-
57
-
58
-
59
-
60
-
61
-
62
-
63
-
64
-
65
-
66
-
67
-
68
-
69
-
70
-
71
-
72
-
73
-
74
-
75
-
76
-
77
-
78
-
79
-
80
-
81
-
82
-
83
-
84
-
85
-
86
-
87
-
88
-
89
-
90
-
91
-
92
-
93
-
94
-
95
-
96
-
97
-
98
-
99
-
100
-
101
-
102
-
103
-
104
-
105
-
106
-
107
-
108
-
109
-
110
-
111
-
112
-
113
-
114
-
115
-
116
-
117
-
118
-
119
-
120
-
121
-
122
-
123
-
124
-
125
-
126
-
127
-
128
-
129
-
130
-
131
-
132
-
133
-
134
-
135
-
136
-
137
-
138
-
139
-
140
-
141
-
142
-
143
-
144
-
145
-
146
-
147
-
148
-
149
-
150
-
151
-
152
-
153
-
154
-
155
-
156
-
157
-
158
-
159
-
160
-
161
-
162
-
163
-
164
-
165
-
166
-
167
-
168
-
169
-
170
-
171
-
172
-
173
-
174
-
175
-
176
-
177
-
178
-
179
-
180
-
181
-
182
-
183
-
184
-
185
-
186
-
187
-
188
-
189
-
190
-
191
-
192
-
193
-
194
-
195
-
196
-
197
-
198
-
199
-
200
-
201
-
 202
202 -
 203
203 -
 204
204 -
 205
205 -
 206
206 -
 207
207 -
 208
208 -
 209
209 -
 210
210 -
 211
211 -
 212
212 -
 213
213 -
 214
214 -
 215
215 -
 216
216 -
 217
217 -
 218
218 -
 219
219 -
 220
220 -
 221
221 -
 222
222 -
223
-
224
-
225
-
226
-
227
-
228
-
229
-
230
-
231
-
232
-
233
-
234
-
235
-
236
-
237
-
238
-
239
-
240
-
241
-
242
-
243
-
244
-
245
-
246
-
247
-
248
-
249
-
250
-
251
-
252
-
253
-
254
-
255
-
256
 |
 |

210 Bank of America 2015
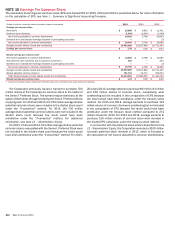
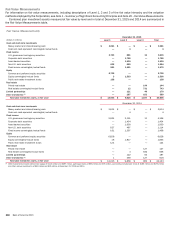
NOTE 15 Earnings Per Common Share
The calculation of earnings per common share (EPS) and diluted EPS for 2015, 2014 and 2013 is presented below. For more information
on the calculation of EPS, see Note 1 – Summary of Significant Accounting Principles.
(Dollars in millions, except per share information; shares in thousands) 2015 2014 2013
Earnings per common share
Net income $ 15,888 $ 4,833 $ 11,431
Preferred stock dividends (1,483)(1,044) (1,349)
Net income applicable to common shareholders 14,405 3,789 10,082
Dividends and undistributed earnings allocated to participating securities —— (2)
Net income allocated to common shareholders $ 14,405 $ 3,789 $ 10,080
Average common shares issued and outstanding 10,462,282 10,527,818 10,731,165
Earnings per common share $ 1.38 $ 0.36 $ 0.94
Diluted earnings per common share
Net income applicable to common shareholders $ 14,405 $ 3,789 $ 10,082
Add preferred stock dividends due to assumed conversions 300 — 300
Dividends and undistributed earnings allocated to participating securities —— (2)
Net income allocated to common shareholders $ 14,705 $ 3,789 $ 10,380
Average common shares issued and outstanding 10,462,282 10,527,818 10,731,165
Dilutive potential common shares (1) 751,710 56,717 760,253
Total diluted average common shares issued and outstanding 11,213,992 10,584,535 11,491,418
Diluted earnings per common share $ 1.31 $ 0.36 $ 0.90
(1) Includes incremental dilutive shares from restricted stock units, restricted stock, stock options and warrants.
The Corporation previously issued a warrant to purchase 700
million shares of the Corporation’s common stock to the holder of
the Series T Preferred Stock. The warrant may be exercised, at the
option of the holder, through tendering the Series T Preferred Stock
or paying cash. For 2015 and 2013, the 700 million average dilutive
potential common shares were included in the diluted share count
under the “if-converted” method. For 2014, the 700 million
average dilutive potential common shares were not included in the
diluted share count because the result would have been
antidilutive under the “if-converted” method. For additional
information, see Note 13 – Shareholders’ Equity.
For 2015, 2014 and 2013, 62 million average dilutive potential
common shares associated with the Series L Preferred Stock were
not included in the diluted share count because the result would
have been antidilutive under the “if-converted” method. For 2015,
2014 and 2013, average options to purchase 66 million, 91 million
and 126 million shares of common stock, respectively, were
outstanding but not included in the computation of EPS because
the result would have been antidilutive under the treasury stock
method. For 2015 and 2014, average warrants to purchase 122
million shares of common stock were outstanding but not included
in the computation of EPS because the result would have been
antidilutive under the treasury stock method compared to 272
million shares for 2013. For 2015 and 2014, average warrants to
purchase 150 million shares of common stock were included in
the diluted EPS calculation under the treasury stock method.
In connection with the preferred stock actions described in Note
13 – Shareholders’ Equity, the Corporation recorded a $100 million
non-cash preferred stock dividend in 2013, which is included in
the calculation of net income allocated to common shareholders.