Bank of America 2015 Annual Report Download - page 25
Download and view the complete annual report
Please find page 25 of the 2015 Bank of America annual report below. You can navigate through the pages in the report by either clicking on the pages listed below, or by using the keyword search tool below to find specific information within the annual report.-
 1
1 -
2
-
3
-
4
-
5
-
6
-
7
-
8
-
9
-
10
-
11
-
12
-
13
-
14
-
 15
15 -
 16
16 -
 17
17 -
 18
18 -
 19
19 -
 20
20 -
 21
21 -
 22
22 -
 23
23 -
 24
24 -
 25
25 -
 26
26 -
 27
27 -
 28
28 -
 29
29 -
 30
30 -
 31
31 -
 32
32 -
 33
33 -
 34
34 -
 35
35 -
36
-
37
-
38
-
39
-
40
-
41
-
42
-
43
-
44
-
45
-
46
-
47
-
48
-
49
-
50
-
51
-
52
-
53
-
54
-
55
-
56
-
57
-
58
-
59
-
60
-
61
-
62
-
63
-
64
-
65
-
66
-
67
-
68
-
69
-
70
-
71
-
72
-
73
-
74
-
75
-
76
-
77
-
78
-
79
-
80
-
81
-
82
-
83
-
84
-
85
-
86
-
87
-
88
-
89
-
90
-
91
-
92
-
93
-
94
-
95
-
96
-
97
-
98
-
99
-
100
-
101
-
102
-
103
-
104
-
105
-
106
-
107
-
108
-
109
-
110
-
111
-
112
-
113
-
114
-
115
-
116
-
117
-
118
-
119
-
120
-
121
-
122
-
123
-
124
-
125
-
126
-
127
-
128
-
129
-
130
-
131
-
132
-
133
-
134
-
135
-
136
-
137
-
138
-
139
-
140
-
141
-
142
-
143
-
144
-
145
-
146
-
147
-
148
-
149
-
150
-
151
-
152
-
153
-
154
-
155
-
156
-
157
-
158
-
159
-
160
-
161
-
162
-
163
-
164
-
165
-
166
-
167
-
168
-
169
-
170
-
171
-
172
-
173
-
174
-
175
-
176
-
177
-
178
-
179
-
180
-
181
-
182
-
183
-
184
-
185
-
186
-
187
-
188
-
189
-
190
-
191
-
192
-
193
-
194
-
195
-
196
-
197
-
198
-
199
-
200
-
201
-
202
-
203
-
204
-
205
-
206
-
207
-
208
-
209
-
210
-
211
-
212
-
213
-
214
-
215
-
216
-
217
-
218
-
219
-
220
-
221
-
222
-
223
-
224
-
225
-
226
-
227
-
228
-
229
-
230
-
231
-
232
-
233
-
234
-
235
-
236
-
237
-
238
-
239
-
240
-
241
-
242
-
243
-
244
-
245
-
246
-
247
-
248
-
249
-
250
-
251
-
252
-
253
-
254
-
255
-
256
 |
 |

Bank of America 2015 23
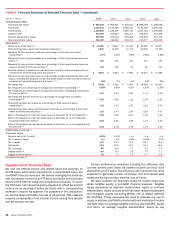
Noninterest Income
Table 3 Noninterest Income
(Dollars in millions) 2015 2014
Card income $ 5,959 $ 5,944
Service charges 7,381 7,443
Investment and brokerage services 13,337 13,284
Investment banking income 5,572 6,065
Equity investment income 261 1,130
Trading account profits 6,473 6,309
Mortgage banking income 2,364 1,563
Gains on sales of debt securities 1,091 1,354
Other income 818 1,203
Total noninterest income $ 43,256 $ 44,295
Noninterest income decreased $1.0 billion to $43.3 billion for
2015 compared to 2014. The following highlights the significant
changes.
Investment banking income decreased $493 million driven by
lower debt and equity issuance fees, partially offset by higher
advisory fees.
Equity investment income decreased $869 million as 2014
included a gain on the sale of a portion of an equity investment
and gains from an initial public offering (IPO) of an equity
investment in Global Markets.
Trading account profits increased $164 million. Excluding DVA,
trading account profits decreased $330 million driven by
declines in credit-related products reflecting lower client activity,
partially offset by strong performance in equity derivatives,
increased client activity in equities in the Asia-Pacific region,
improvement in currencies on higher client flows and increased
volatility. For more information on trading account profits, see
Global Markets on page 38.
Mortgage banking income increased $801 million primarily due
to lower provision for representations and warranties in 2015
compared to 2014, and to a lesser extent, improved mortgage
servicing rights (MSR) net-of-hedge performance and an
increase in core production revenue, partially offset by a decline
in servicing fees.
Other income decreased $385 million primarily due to DVA gains
of $407 million in 2014 compared to DVA losses of $633 million
in 2015, partially offset by higher gains on asset sales and lower
U.K. consumer payment protection insurance (PPI) costs in
2015. For more information on the accounting change related
to DVA, see Executive Summary – Recent Events on page 20.
Provision for Credit Losses
Table 4 Credit Quality Data
(Dollars in millions) 2015 2014
Provision for credit losses
Consumer $ 2,208 $ 1,482
Commercial 953 793
Total provision for credit losses $ 3,161 $ 2,275
Net charge-offs (1) $ 4,338 $ 4,383
Net charge-off ratio (2) 0.50% 0.49%
(1) Net charge-offs exclude write-offs in the purchased credit-impaired loan portfolio.
(2) Net charge-off ratios are calculated as net charge-offs divided by average outstanding loans
and leases excluding loans accounted for under the fair value option.
The provision for credit losses increased $886 million to $3.2
billion for 2015 compared to 2014. The provision for credit losses
was $1.2 billion lower than net charge-offs for 2015, resulting in
a reduction in the allowance for credit losses. The provision for
credit losses in 2014 included $400 million of additional costs
associated with the consumer relief portion of the settlement with
the U.S. Department of Justice (DoJ). Excluding these additional
costs, the provision for credit losses in the consumer portfolio
increased $1.1 billion compared to 2014 due to a slower pace of
portfolio improvement than in 2014, and also due to a lower level
of recoveries on nonperforming loan sales and other recoveries in
2015. The provision for credit losses for the commercial portfolio
increased $160 million in 2015 compared to 2014 driven by
energy sector exposure and higher unfunded balances. The
decrease in net charge-offs was primarily due to credit quality
improvement in the consumer portfolio, partially offset by higher
net charge-offs in the commercial portfolio primarily due to lower
net recoveries in commercial real estate and higher energy-related
net charge-offs.
As we look at 2016, reserve releases are expected to decrease
from 2015 levels. All else equal, this would result in increased
provision expense, assuming sustained stability in underlying
asset quality. For more information on the provision for credit
losses, see Provision for Credit Losses on page 86.