Bank of America 2015 Annual Report Download - page 155
Download and view the complete annual report
Please find page 155 of the 2015 Bank of America annual report below. You can navigate through the pages in the report by either clicking on the pages listed below, or by using the keyword search tool below to find specific information within the annual report.-
 1
1 -
2
-
3
-
4
-
5
-
6
-
7
-
8
-
9
-
10
-
11
-
12
-
13
-
14
-
15
-
16
-
17
-
18
-
19
-
20
-
21
-
22
-
23
-
24
-
25
-
26
-
27
-
28
-
29
-
30
-
31
-
32
-
33
-
34
-
35
-
36
-
37
-
38
-
39
-
40
-
41
-
42
-
43
-
44
-
45
-
46
-
47
-
48
-
49
-
50
-
51
-
52
-
53
-
54
-
55
-
56
-
57
-
58
-
59
-
60
-
61
-
62
-
63
-
64
-
65
-
66
-
67
-
68
-
69
-
70
-
71
-
72
-
73
-
74
-
75
-
76
-
77
-
78
-
79
-
80
-
81
-
82
-
83
-
84
-
85
-
86
-
87
-
88
-
89
-
90
-
91
-
92
-
93
-
94
-
95
-
96
-
97
-
98
-
99
-
100
-
101
-
102
-
103
-
104
-
105
-
106
-
107
-
108
-
109
-
110
-
111
-
112
-
113
-
114
-
115
-
116
-
117
-
118
-
119
-
120
-
121
-
122
-
123
-
124
-
125
-
126
-
127
-
128
-
129
-
130
-
131
-
132
-
133
-
134
-
135
-
136
-
137
-
138
-
139
-
140
-
141
-
142
-
143
-
144
-
 145
145 -
 146
146 -
 147
147 -
 148
148 -
 149
149 -
 150
150 -
 151
151 -
 152
152 -
 153
153 -
 154
154 -
 155
155 -
 156
156 -
 157
157 -
 158
158 -
 159
159 -
 160
160 -
 161
161 -
 162
162 -
 163
163 -
 164
164 -
 165
165 -
166
-
167
-
168
-
169
-
170
-
171
-
172
-
173
-
174
-
175
-
176
-
177
-
178
-
179
-
180
-
181
-
182
-
183
-
184
-
185
-
186
-
187
-
188
-
189
-
190
-
191
-
192
-
193
-
194
-
195
-
196
-
197
-
198
-
199
-
200
-
201
-
202
-
203
-
204
-
205
-
206
-
207
-
208
-
209
-
210
-
211
-
212
-
213
-
214
-
215
-
216
-
217
-
218
-
219
-
220
-
221
-
222
-
223
-
224
-
225
-
226
-
227
-
228
-
229
-
230
-
231
-
232
-
233
-
234
-
235
-
236
-
237
-
238
-
239
-
240
-
241
-
242
-
243
-
244
-
245
-
246
-
247
-
248
-
249
-
250
-
251
-
252
-
253
-
254
-
255
-
256
 |
 |

Bank of America 2015 153
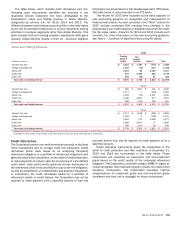
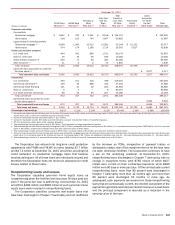
The table below, which includes both derivatives and non-
derivative cash instruments, identifies the amounts in the
respective income statement line items attributable to the
Corporation’s sales and trading revenue in Global Markets,
categorized by primary risk, for 2015, 2014 and 2013. The
difference between total trading account profits in the table below
and in the Consolidated Statement of Income represents trading
activities in business segments other than Global Markets. This
table includes DVA and funding valuation adjustment (FVA) gains
(losses). Global Markets results in Note 24 – Business Segment
Information are presented on a fully taxable-equivalent (FTE) basis.
The table below is not presented on an FTE basis.
The results for 2015 were impacted by the early adoption of
new accounting guidance on recognition and measurement of
financial instruments. As such, amounts in the "Other" column for
2015 exclude unrealized DVA resulting from changes in the
Corporation’s own credit spreads on liabilities accounted for under
the fair value option. Amounts for 2014 and 2013 include such
amounts. For more information on the new accounting guidance,
see Note 1 – Summary of Significant Accounting Principles.
Sales and Trading Revenue
2015
(Dollars in millions)
Trading
Account
Profits
Net
Interest
Income Other (1) Total
Interest rate risk $ 1,251 $ 1,457 $ (319) $ 2,389
Foreign exchange risk 1,322 (10) (117) 1,195
Equity risk 2,115 56 2,146 4,317
Credit risk 901 2,360 452 3,713
Other risk 481 (80) 61 462
Total sales and trading revenue $ 6,070 $ 3,783 $ 2,223 $ 12,076
2014
Interest rate risk $ 962 $ 1,097 $ 401 $ 2,460
Foreign exchange risk 1,177 7 (128) 1,056
Equity risk 1,954 (79) 2,307 4,182
Credit risk 1,396 2,563 617 4,576
Other risk 508 (123) 106 491
Total sales and trading revenue $ 5,997 $ 3,465 $ 3,303 $ 12,765
2013
Interest rate risk $ 1,217 $ 1,158 $ (290) $ 2,085
Foreign exchange risk 1,169 6 (100) 1,075
Equity risk 1,994 112 2,066 4,172
Credit risk 1,966 2,647 77 4,690
Other risk 388 (217) 69 240
Total sales and trading revenue $ 6,734 $ 3,706 $ 1,822 $ 12,262
(1) Represents amounts in investment and brokerage services and other income that are recorded in Global Markets and included in the definition of sales and trading revenue. Includes investment and
brokerage services revenue of $2.2 billion, $2.2 billion and $2.1 billion for 2015, 2014 and 2013, respectively.
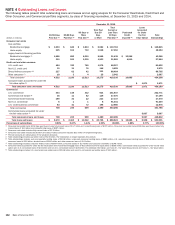
Credit Derivatives
The Corporation enters into credit derivatives primarily to facilitate
client transactions and to manage credit risk exposures. Credit
derivatives derive value based on an underlying third-party
referenced obligation or a portfolio of referenced obligations and
generally require the Corporation, as the seller of credit protection,
to make payments to a buyer upon the occurrence of a pre-defined
credit event. Such credit events generally include bankruptcy of
the referenced credit entity and failure to pay under the obligation,
as well as acceleration of indebtedness and payment repudiation
or moratorium. For credit derivatives based on a portfolio of
referenced credits or credit indices, the Corporation may not be
required to make payment until a specified amount of loss has
occurred and/or may only be required to make payment up to a
specified amount.
Credit derivative instruments where the Corporation is the
seller of credit protection and their expiration at December 31,
2015 and 2014 are summarized in the table below. These
instruments are classified as investment and non-investment
grade based on the credit quality of the underlying referenced
obligation. The Corporation considers ratings of BBB- or higher as
investment grade. Non-investment grade includes non-rated credit
derivative instruments. The Corporation discloses internal
categorizations of investment grade and non-investment grade
consistent with how risk is managed for these instruments.