Bank of America 2015 Annual Report Download - page 185
Download and view the complete annual report
Please find page 185 of the 2015 Bank of America annual report below. You can navigate through the pages in the report by either clicking on the pages listed below, or by using the keyword search tool below to find specific information within the annual report.-
 1
1 -
2
-
3
-
4
-
5
-
6
-
7
-
8
-
9
-
10
-
11
-
12
-
13
-
14
-
15
-
16
-
17
-
18
-
19
-
20
-
21
-
22
-
23
-
24
-
25
-
26
-
27
-
28
-
29
-
30
-
31
-
32
-
33
-
34
-
35
-
36
-
37
-
38
-
39
-
40
-
41
-
42
-
43
-
44
-
45
-
46
-
47
-
48
-
49
-
50
-
51
-
52
-
53
-
54
-
55
-
56
-
57
-
58
-
59
-
60
-
61
-
62
-
63
-
64
-
65
-
66
-
67
-
68
-
69
-
70
-
71
-
72
-
73
-
74
-
75
-
76
-
77
-
78
-
79
-
80
-
81
-
82
-
83
-
84
-
85
-
86
-
87
-
88
-
89
-
90
-
91
-
92
-
93
-
94
-
95
-
96
-
97
-
98
-
99
-
100
-
101
-
102
-
103
-
104
-
105
-
106
-
107
-
108
-
109
-
110
-
111
-
112
-
113
-
114
-
115
-
116
-
117
-
118
-
119
-
120
-
121
-
122
-
123
-
124
-
125
-
126
-
127
-
128
-
129
-
130
-
131
-
132
-
133
-
134
-
135
-
136
-
137
-
138
-
139
-
140
-
141
-
142
-
143
-
144
-
145
-
146
-
147
-
148
-
149
-
150
-
151
-
152
-
153
-
154
-
155
-
156
-
157
-
158
-
159
-
160
-
161
-
162
-
163
-
164
-
165
-
166
-
167
-
168
-
169
-
170
-
171
-
172
-
173
-
174
-
 175
175 -
 176
176 -
 177
177 -
 178
178 -
 179
179 -
 180
180 -
 181
181 -
 182
182 -
 183
183 -
 184
184 -
 185
185 -
 186
186 -
 187
187 -
 188
188 -
 189
189 -
 190
190 -
 191
191 -
 192
192 -
 193
193 -
 194
194 -
 195
195 -
196
-
197
-
198
-
199
-
200
-
201
-
202
-
203
-
204
-
205
-
206
-
207
-
208
-
209
-
210
-
211
-
212
-
213
-
214
-
215
-
216
-
217
-
218
-
219
-
220
-
221
-
222
-
223
-
224
-
225
-
226
-
227
-
228
-
229
-
230
-
231
-
232
-
233
-
234
-
235
-
236
-
237
-
238
-
239
-
240
-
241
-
242
-
243
-
244
-
245
-
246
-
247
-
248
-
249
-
250
-
251
-
252
-
253
-
254
-
255
-
256
 |
 |

Bank of America 2015 183
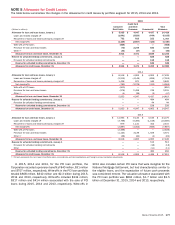
million following the transfer of servicing and sale of retained
interests to third parties. No gain or loss was recorded as a result
of the deconsolidation. The derecognition of assets and liabilities
represents non-cash investing and financing activities and,
accordingly, is not reflected on the Consolidated Statement of Cash
Flows.
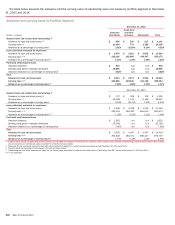
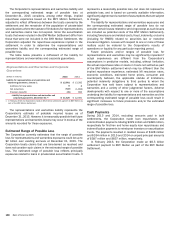
Other Variable Interest Entities
The table below summarizes select information related to other
VIEs in which the Corporation held a variable interest at
December 31, 2015 and 2014.
Other VIEs
December 31
2015 2014
(Dollars in millions) Consolidated Unconsolidated Total Consolidated Unconsolidated Total
Maximum loss exposure $ 6,295 $ 12,916 $ 19,211 $ 7,981 $ 12,391 $ 20,372
On-balance sheet assets
Trading account assets $ 2,300 $ 366 $ 2,666 $ 1,575 $ 355 $ 1,930
Debt securities carried at fair value — 126 126 — 483 483
Loans and leases 3,317 3,389 6,706 4,020 2,693 6,713
Allowance for loan and lease losses (9) (23) (32) (6) — (6)
Loans held-for-sale 284 1,025 1,309 1,267 814 2,081
All other assets 664 6,925 7,589 1,646 6,658 8,304
Total $ 6,556 $ 11,808 $ 18,364 $ 8,502 $ 11,003 $ 19,505
On-balance sheet liabilities
Long-term debt (1) $ 3,025 $ — $ 3,025 $ 1,834 $ — $ 1,834
All other liabilities 5 2,697 2,702 105 2,643 2,748
Total $ 3,030 $ 2,697 $ 5,727 $ 1,939 $ 2,643 $ 4,582
Total assets of VIEs $ 6,556 $ 40,894 $ 47,450 $ 8,502 $ 41,467 $ 49,969
(1) Includes $2.8 billion and $1.4 billion of long-term debt at December 31, 2015 and 2014 issued by other consolidated VIEs, which has recourse to the general credit of the Corporation.
During 2015, the Corporation consolidated certain customer
vehicles after redeeming long-term debt owed to the vehicles and
acquiring a controlling financial interest in the vehicles. The
Corporation also deconsolidated certain investment vehicles
following the sale or disposition of variable interests. These
actions resulted in a net decrease in long-term debt of $1.2 billion
which represents a non-cash financing activity and, accordingly, is
not reflected on the Consolidated Statement of Cash Flows. No
gain or loss was recorded as a result of the consolidation or
deconsolidation of these VIEs.
Customer Vehicles
Customer vehicles include credit-linked, equity-linked and
commodity-linked note vehicles, repackaging vehicles, and asset
acquisition vehicles, which are typically created on behalf of
customers who wish to obtain market or credit exposure to a
specific company, index, commodity or financial instrument. The
Corporation may transfer assets to and invest in securities issued
by these vehicles. The Corporation typically enters into credit,
equity, interest rate, commodity or foreign currency derivatives to
synthetically create or alter the investment profile of the issued
securities.
The Corporation’s maximum loss exposure to consolidated and
unconsolidated customer vehicles totaled $3.9 billion and $4.7
billion at December 31, 2015 and 2014, including the notional
amount of derivatives to which the Corporation is a counterparty,
net of losses previously recorded, and the Corporation’s
investment, if any, in securities issued by the vehicles. The
maximum loss exposure has not been reduced to reflect the benefit
of offsetting swaps with the customers or collateral arrangements.
The Corporation also had liquidity commitments, including written
put options and collateral value guarantees, with certain
unconsolidated vehicles of $691 million and $658 million at
December 31, 2015 and 2014, that are included in the table
above.
Collateralized Debt Obligation Vehicles
The Corporation receives fees for structuring CDO vehicles, which
hold diversified pools of fixed-income securities, typically corporate
debt or ABS, which the CDO vehicles fund by issuing multiple
tranches of debt and equity securities. Synthetic CDOs enter into
a portfolio of CDS to synthetically create exposure to fixed-income
securities. CLOs, which are a subset of CDOs, hold pools of loans,
typically corporate loans. CDOs are typically managed by third-
party portfolio managers. The Corporation typically transfers
assets to these CDOs, holds securities issued by the CDOs and
may be a derivative counterparty to the CDOs, including a CDS
counterparty for synthetic CDOs. The Corporation has also entered
into total return swaps with certain CDOs whereby the Corporation
absorbs the economic returns generated by specified assets held
by the CDO.