Bank of America 2015 Annual Report Download - page 174
Download and view the complete annual report
Please find page 174 of the 2015 Bank of America annual report below. You can navigate through the pages in the report by either clicking on the pages listed below, or by using the keyword search tool below to find specific information within the annual report.-
 1
1 -
2
-
3
-
4
-
5
-
6
-
7
-
8
-
9
-
10
-
11
-
12
-
13
-
14
-
15
-
16
-
17
-
18
-
19
-
20
-
21
-
22
-
23
-
24
-
25
-
26
-
27
-
28
-
29
-
30
-
31
-
32
-
33
-
34
-
35
-
36
-
37
-
38
-
39
-
40
-
41
-
42
-
43
-
44
-
45
-
46
-
47
-
48
-
49
-
50
-
51
-
52
-
53
-
54
-
55
-
56
-
57
-
58
-
59
-
60
-
61
-
62
-
63
-
64
-
65
-
66
-
67
-
68
-
69
-
70
-
71
-
72
-
73
-
74
-
75
-
76
-
77
-
78
-
79
-
80
-
81
-
82
-
83
-
84
-
85
-
86
-
87
-
88
-
89
-
90
-
91
-
92
-
93
-
94
-
95
-
96
-
97
-
98
-
99
-
100
-
101
-
102
-
103
-
104
-
105
-
106
-
107
-
108
-
109
-
110
-
111
-
112
-
113
-
114
-
115
-
116
-
117
-
118
-
119
-
120
-
121
-
122
-
123
-
124
-
125
-
126
-
127
-
128
-
129
-
130
-
131
-
132
-
133
-
134
-
135
-
136
-
137
-
138
-
139
-
140
-
141
-
142
-
143
-
144
-
145
-
146
-
147
-
148
-
149
-
150
-
151
-
152
-
153
-
154
-
155
-
156
-
157
-
158
-
159
-
160
-
161
-
162
-
163
-
 164
164 -
 165
165 -
 166
166 -
 167
167 -
 168
168 -
 169
169 -
 170
170 -
 171
171 -
 172
172 -
 173
173 -
 174
174 -
 175
175 -
 176
176 -
 177
177 -
 178
178 -
 179
179 -
 180
180 -
 181
181 -
 182
182 -
 183
183 -
 184
184 -
185
-
186
-
187
-
188
-
189
-
190
-
191
-
192
-
193
-
194
-
195
-
196
-
197
-
198
-
199
-
200
-
201
-
202
-
203
-
204
-
205
-
206
-
207
-
208
-
209
-
210
-
211
-
212
-
213
-
214
-
215
-
216
-
217
-
218
-
219
-
220
-
221
-
222
-
223
-
224
-
225
-
226
-
227
-
228
-
229
-
230
-
231
-
232
-
233
-
234
-
235
-
236
-
237
-
238
-
239
-
240
-
241
-
242
-
243
-
244
-
245
-
246
-
247
-
248
-
249
-
250
-
251
-
252
-
253
-
254
-
255
-
256
 |
 |

172 Bank of America 2015
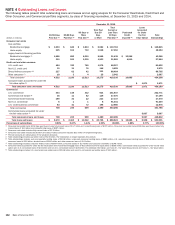
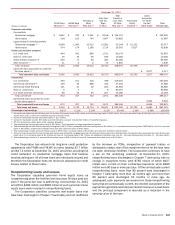
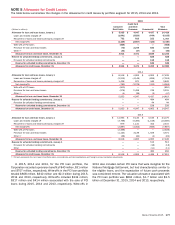
The table below provides the unpaid principal balance, carrying value and related allowance at December 31, 2015 and 2014, and
the average carrying value and interest income recognized for 2015, 2014 and 2013 on the Corporation’s renegotiated TDR portfolio
in the Credit Card and Other Consumer portfolio segment.
Impaired Loans – Credit Card and Other Consumer – Renegotiated TDRs
December 31, 2015 December 31, 2014
(Dollars in millions)
Unpaid
Principal
Balance
Carrying
Value (1)
Related
Allowance
Unpaid
Principal
Balance
Carrying
Value (1)
Related
Allowance
With no recorded allowance
Direct/Indirect consumer $ 50 $ 21 $ — $ 59 $ 25 $ —
With an allowance recorded
U.S. credit card $ 598 $ 611 $176 $ 804 $ 856 $ 207
Non-U.S. credit card 109 126 70 132 168 108
Direct/Indirect consumer 17 21 4 76 92 24
Total
U.S. credit card $ 598 $ 611 $176 $ 804 $ 856 $ 207
Non-U.S. credit card 109 126 70 132 168 108
Direct/Indirect consumer 67 42 4 135 117 24
2015 2014 2013
Average
Carrying
Value
Interest
Income
Recognized (2)
Average
Carrying
Value
Interest
Income
Recognized (2)
Average
Carrying
Value
Interest
Income
Recognized (2)
With no recorded allowance
Direct/Indirect consumer $ 22 $ — $ 27 $ — $ 42 $ —
Other consumer — — 33 2 34 2
With an allowance recorded
U.S. credit card $ 749 $ 43 $ 1,148 $ 71 $ 2,144 $ 134
Non-U.S. credit card 145 4 210 6 266 7
Direct/Indirect consumer 51 3 180 9 456 24
Other consumer — — 23 1 28 2
Total
U.S. credit card $ 749 $ 43 $ 1,148 $ 71 $ 2,144 $ 134
Non-U.S. credit card 145 4 210 6 266 7
Direct/Indirect consumer 73 3 207 9 498 24
Other consumer — — 56 3 62 4
(1) Includes accrued interest and fees.
(2) Interest income recognized includes interest accrued and collected on the outstanding balances of accruing impaired loans as well as interest cash collections on nonaccruing impaired loans for
which the principal is considered collectible.
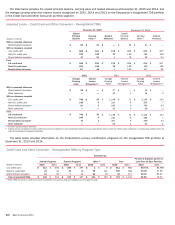
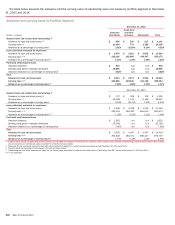
The table below provides information on the Corporation’s primary modification programs for the renegotiated TDR portfolio at
December 31, 2015 and 2014.
Credit Card and Other Consumer – Renegotiated TDRs by Program Type
December 31
Internal Programs External Programs Other (1) Total
Percent of Balances Current or
Less Than 30 Days Past Due
(Dollars in millions) 2015 2014 2015 2014 2015 2014 2015 2014 2015 2014
U.S. credit card $ 313 $ 450 $ 296 $ 397 $2
$9
$611 $ 856 88.74% 84.99%
Non-U.S. credit card 21 41 10 16 95 111 126 168 44.25 47.56
Direct/Indirect consumer 11 50 734 24 33 42 117 89.12 85.21
Total renegotiated TDRs $ 345 $ 541 $ 313 $ 447 $121 $ 153 $779 $ 1,141 81.55 79.51
(1) Other TDRs for non-U.S. credit card include modifications of accounts that are ineligible for a fixed payment plan.