Bank of America 2015 Annual Report Download - page 75
Download and view the complete annual report
Please find page 75 of the 2015 Bank of America annual report below. You can navigate through the pages in the report by either clicking on the pages listed below, or by using the keyword search tool below to find specific information within the annual report.-
 1
1 -
2
-
3
-
4
-
5
-
6
-
7
-
8
-
9
-
10
-
11
-
12
-
13
-
14
-
15
-
16
-
17
-
18
-
19
-
20
-
21
-
22
-
23
-
24
-
25
-
26
-
27
-
28
-
29
-
30
-
31
-
32
-
33
-
34
-
35
-
36
-
37
-
38
-
39
-
40
-
41
-
42
-
43
-
44
-
45
-
46
-
47
-
48
-
49
-
50
-
51
-
52
-
53
-
54
-
55
-
56
-
57
-
58
-
59
-
60
-
61
-
62
-
63
-
64
-
 65
65 -
 66
66 -
 67
67 -
 68
68 -
 69
69 -
 70
70 -
 71
71 -
 72
72 -
 73
73 -
 74
74 -
 75
75 -
 76
76 -
 77
77 -
 78
78 -
 79
79 -
 80
80 -
 81
81 -
 82
82 -
 83
83 -
 84
84 -
 85
85 -
86
-
87
-
88
-
89
-
90
-
91
-
92
-
93
-
94
-
95
-
96
-
97
-
98
-
99
-
100
-
101
-
102
-
103
-
104
-
105
-
106
-
107
-
108
-
109
-
110
-
111
-
112
-
113
-
114
-
115
-
116
-
117
-
118
-
119
-
120
-
121
-
122
-
123
-
124
-
125
-
126
-
127
-
128
-
129
-
130
-
131
-
132
-
133
-
134
-
135
-
136
-
137
-
138
-
139
-
140
-
141
-
142
-
143
-
144
-
145
-
146
-
147
-
148
-
149
-
150
-
151
-
152
-
153
-
154
-
155
-
156
-
157
-
158
-
159
-
160
-
161
-
162
-
163
-
164
-
165
-
166
-
167
-
168
-
169
-
170
-
171
-
172
-
173
-
174
-
175
-
176
-
177
-
178
-
179
-
180
-
181
-
182
-
183
-
184
-
185
-
186
-
187
-
188
-
189
-
190
-
191
-
192
-
193
-
194
-
195
-
196
-
197
-
198
-
199
-
200
-
201
-
202
-
203
-
204
-
205
-
206
-
207
-
208
-
209
-
210
-
211
-
212
-
213
-
214
-
215
-
216
-
217
-
218
-
219
-
220
-
221
-
222
-
223
-
224
-
225
-
226
-
227
-
228
-
229
-
230
-
231
-
232
-
233
-
234
-
235
-
236
-
237
-
238
-
239
-
240
-
241
-
242
-
243
-
244
-
245
-
246
-
247
-
248
-
249
-
250
-
251
-
252
-
253
-
254
-
255
-
256
 |
 |

Bank of America 2015 73
Direct/Indirect Consumer
At December 31, 2015, approximately 50 percent of the direct/
indirect portfolio was included in GWIM (principally securities-
based lending loans), 49 percent was included in Consumer
Banking (consumer auto and specialty lending – automotive,
marine, aircraft, recreational vehicle loans and consumer personal
loans) and the remainder was primarily student loans in All Other.
Outstandings in the direct/indirect portfolio increased $8.4
billion in 2015 as growth in the consumer auto portfolio and growth
in securities-based lending were partially offset by lower
outstandings in the unsecured consumer lending portfolio.
Net charge-offs decreased $57 million to $112 million in 2015,
or 0.13 percent of total average direct/indirect loans, compared
to $169 million, or 0.20 percent, in 2014. This decrease in net
charge-offs was primarily driven by improvements in delinquencies
and bankruptcies in the unsecured consumer lending portfolio as
a result of an improved economic environment as well as reduced
outstandings in this portfolio.
Direct/indirect loans that were past due 90 days or more and
still accruing interest declined $25 million to $39 million in 2015
due to decreases in the unsecured consumer lending, and
consumer auto and specialty lending portfolios.
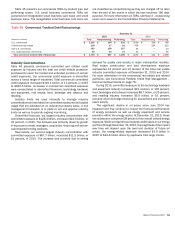
Table 34 presents certain state concentrations for the direct/
indirect consumer loan portfolio.
Table 34 Direct/Indirect State Concentrations
December 31
Outstandings
Accruing Past Due
90 Days or More Net Charge-offs
(Dollars in millions) 2015 2014 2015 2014 2015 2014
California $ 10,735 $ 9,770 $3
$5
$8
$ 18
Florida 8,835 7,930 3520 27
Texas 8,514 7,741 4517 19
New York 5,077 4,458 1239
Illinois 2,906 2,550 1235
Other U.S./Non-U.S. 52,728 47,932 27 45 61 91
Total direct/indirect loan portfolio $ 88,795 $ 80,381 $ 39 $ 64 $112 $ 169
Other Consumer
At December 31, 2015, approximately 66 percent of the $2.1
billion other consumer portfolio was consumer auto leases
included in Consumer Banking. The remainder is primarily
associated with certain consumer finance businesses that we
previously exited.
Nonperforming Consumer Loans, Leases and Foreclosed
Properties Activity
Table 35 presents nonperforming consumer loans, leases and
foreclosed properties activity during 2015 and 2014.
Nonperforming LHFS are excluded from nonperforming loans as
they are recorded at either fair value or the lower of cost or fair
value. Nonperforming loans do not include past due consumer
credit card loans, other unsecured loans and in general, consumer
non-real estate-secured loans (loans discharged in Chapter 7
bankruptcy are included) as these loans are typically charged off
no later than the end of the month in which the loan becomes
180 days past due. The charge-offs on these loans have no impact
on nonperforming activity and, accordingly, are excluded from this
table. The fully-insured loan portfolio is not reported as
nonperforming as principal repayment is insured. Additionally,
nonperforming loans do not include the PCI loan portfolio or loans
accounted for under the fair value option. For more information on
nonperforming loans, see Note 1 – Summary of Significant
Accounting Principles to the Consolidated Financial Statements.
During 2015, nonperforming consumer loans declined $2.7 billion
to $8.2 billion and included the impact of sales of $1.7 billion,
partially offset by a net increase of $186 million related to the
impact of the consumer relief portion of the DoJ Settlement for
those loans that are no longer fully insured. Excluding these,
nonperforming loans declined as outflows, including the transfer
of certain qualifying borrowers discharged in a Chapter 7
bankruptcy to performing status, outpaced new inflows.
The outstanding balance of a real estate-secured loan that is
in excess of the estimated property value less costs to sell is
charged off no later than the end of the month in which the loan
becomes 180 days past due unless repayment of the loan is fully
insured. At December 31, 2015, $3.8 billion, or 44 percent of
nonperforming consumer real estate loans and foreclosed
properties had been written down to their estimated property value
less costs to sell, including $3.3 billion of nonperforming loans
180 days or more past due and $444 million of foreclosed
properties. In addition, at December 31, 2015, $3.0 billion, or 35
percent of nonperforming consumer loans were modified and are
now current after successful trial periods, or are current loans
classified as nonperforming loans in accordance with applicable
policies.
Foreclosed properties decreased $186 million in 2015 as
liquidations outpaced additions. PCI loans are excluded from
nonperforming loans as these loans were written down to fair value
at the acquisition date; however, once the underlying real estate
is acquired by the Corporation upon foreclosure of the delinquent
PCI loan, it is included in foreclosed properties. PCI-related
foreclosed properties increased $39 million in 2015. Not included
in foreclosed properties at December 31, 2015 was $1.4 billion
of real estate that was acquired upon foreclosure of certain
delinquent government-guaranteed loans (principally FHA-insured
loans). We exclude these amounts from our nonperforming loans
and foreclosed properties activity as we expect we will be
reimbursed once the property is conveyed to the guarantor for
principal and, up to certain limits, costs incurred during the
foreclosure process and interest incurred during the holding
period.