Bank of America 2015 Annual Report Download - page 191
Download and view the complete annual report
Please find page 191 of the 2015 Bank of America annual report below. You can navigate through the pages in the report by either clicking on the pages listed below, or by using the keyword search tool below to find specific information within the annual report.-
 1
1 -
2
-
3
-
4
-
5
-
6
-
7
-
8
-
9
-
10
-
11
-
12
-
13
-
14
-
15
-
16
-
17
-
18
-
19
-
20
-
21
-
22
-
23
-
24
-
25
-
26
-
27
-
28
-
29
-
30
-
31
-
32
-
33
-
34
-
35
-
36
-
37
-
38
-
39
-
40
-
41
-
42
-
43
-
44
-
45
-
46
-
47
-
48
-
49
-
50
-
51
-
52
-
53
-
54
-
55
-
56
-
57
-
58
-
59
-
60
-
61
-
62
-
63
-
64
-
65
-
66
-
67
-
68
-
69
-
70
-
71
-
72
-
73
-
74
-
75
-
76
-
77
-
78
-
79
-
80
-
81
-
82
-
83
-
84
-
85
-
86
-
87
-
88
-
89
-
90
-
91
-
92
-
93
-
94
-
95
-
96
-
97
-
98
-
99
-
100
-
101
-
102
-
103
-
104
-
105
-
106
-
107
-
108
-
109
-
110
-
111
-
112
-
113
-
114
-
115
-
116
-
117
-
118
-
119
-
120
-
121
-
122
-
123
-
124
-
125
-
126
-
127
-
128
-
129
-
130
-
131
-
132
-
133
-
134
-
135
-
136
-
137
-
138
-
139
-
140
-
141
-
142
-
143
-
144
-
145
-
146
-
147
-
148
-
149
-
150
-
151
-
152
-
153
-
154
-
155
-
156
-
157
-
158
-
159
-
160
-
161
-
162
-
163
-
164
-
165
-
166
-
167
-
168
-
169
-
170
-
171
-
172
-
173
-
174
-
175
-
176
-
177
-
178
-
179
-
180
-
 181
181 -
 182
182 -
 183
183 -
 184
184 -
 185
185 -
 186
186 -
 187
187 -
 188
188 -
 189
189 -
 190
190 -
 191
191 -
 192
192 -
 193
193 -
 194
194 -
 195
195 -
 196
196 -
 197
197 -
 198
198 -
 199
199 -
 200
200 -
 201
201 -
202
-
203
-
204
-
205
-
206
-
207
-
208
-
209
-
210
-
211
-
212
-
213
-
214
-
215
-
216
-
217
-
218
-
219
-
220
-
221
-
222
-
223
-
224
-
225
-
226
-
227
-
228
-
229
-
230
-
231
-
232
-
233
-
234
-
235
-
236
-
237
-
238
-
239
-
240
-
241
-
242
-
243
-
244
-
245
-
246
-
247
-
248
-
249
-
250
-
251
-
252
-
253
-
254
-
255
-
256
 |
 |

Bank of America 2015 189
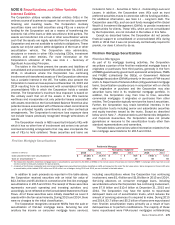
NOTE 8 Goodwill and Intangible Assets
Goodwill
The table below presents goodwill balances by business segment
at December 31, 2015 and 2014. The reporting units utilized for
goodwill impairment testing are the operating segments or one
level below.
Goodwill (1)
December 31
(Dollars in millions) 2015 2014
Consumer Banking $ 30,123 $ 30,123
Global Wealth & Investment Management 9,698 9,698
Global Banking 23,923 23,923
Global Markets 5,197 5,197
All Other 820 836
Total goodwill $ 69,761 $ 69,777
(1) There was no goodwill in LAS at December 31, 2015 and 2014.
For purposes of goodwill impairment testing, the Corporation
utilizes allocated equity as a proxy for the carrying value of its
reporting units. Allocated equity in the reporting units is comprised
of allocated capital plus capital for the portion of goodwill and
intangibles specifically assigned to the reporting unit. The goodwill
impairment test involves comparing the fair value of each reporting
unit to its carrying value, including goodwill, as measured by
allocated equity.
Annual Impairment Tests
The Corporation completed its annual goodwill impairment tests
as of June 30, 2015 and 2014 for all applicable reporting units.
Based on the results of the annual goodwill impairment test, the
Corporation determined there was no impairment.
Effective January 1, 2015, the Corporation changed its basis
of presentation related to its business segments. The realignment
triggered a test for goodwill impairment, which was performed both
immediately before and after the realignment. The fair value of the
affected reporting units exceeded their carrying value and,
accordingly, no goodwill impairment resulted from the realignment.
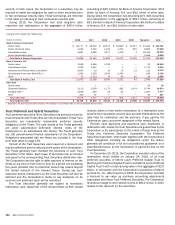
Intangible Assets
The table below presents the gross and net carrying values and accumulated amortization for intangible assets at December 31, 2015
and 2014.
Intangible Assets (1, 2)
December 31
2015 2014
(Dollars in millions)
Gross
Carrying Value
Accumulated
Amortization
Net
Carrying Value
Gross
Carrying Value
Accumulated
Amortization
Net
Carrying Value
Purchased credit card relationships $ 5,450 $ 4,755 $ 695 $ 5,504 $ 4,527 $ 977
Core deposit intangibles 1,779 1,505 274 1,779 1,382 397
Customer relationships 3,927 2,990 937 4,025 2,648 1,377
Affinity relationships 1,556 1,356 200 1,565 1,283 282
Other intangibles (3) 2,143 481 1,662 2,045 466 1,579
Total intangible assets $ 14,855 $ 11,087 $ 3,768 $ 14,918 $ 10,306 $ 4,612
(1) Excludes fully amortized intangible assets.
(2) At December 31, 2015 and 2014, none of the intangible assets were impaired.
(3) Includes intangible assets associated with trade names that have an indefinite life and, accordingly, are not amortized.
The tables below present intangible asset amortization expense for 2015, 2014 and 2013, and estimated future intangible asset
amortization expense as of December 31, 2015.
Amortization Expense
(Dollars in millions) 2015 2014 2013
Purchased credit card and affinity relationships $356 $ 415 $ 475
Core deposit intangibles 122 140 197
Customer relationships 340 355 371
Other intangibles 16 26 43
Total amortization expense $ 834 $ 936 $ 1,086
Estimated Future Amortization Expense
(Dollars in millions) 2016 2017 2018 2019 2020
Purchased credit card and affinity relationships $ 298 $ 237 $ 179 $ 121 $ 60
Core deposit intangibles 104 90 80 — —
Customer relationships 325 310 302 — —
Other intangibles 10 6 4 2 —
Total estimated future amortization expense $ 737 $ 643 $565 $123 $ 60