Bank of America 2015 Annual Report Download - page 109
Download and view the complete annual report
Please find page 109 of the 2015 Bank of America annual report below. You can navigate through the pages in the report by either clicking on the pages listed below, or by using the keyword search tool below to find specific information within the annual report.-
 1
1 -
2
-
3
-
4
-
5
-
6
-
7
-
8
-
9
-
10
-
11
-
12
-
13
-
14
-
15
-
16
-
17
-
18
-
19
-
20
-
21
-
22
-
23
-
24
-
25
-
26
-
27
-
28
-
29
-
30
-
31
-
32
-
33
-
34
-
35
-
36
-
37
-
38
-
39
-
40
-
41
-
42
-
43
-
44
-
45
-
46
-
47
-
48
-
49
-
50
-
51
-
52
-
53
-
54
-
55
-
56
-
57
-
58
-
59
-
60
-
61
-
62
-
63
-
64
-
65
-
66
-
67
-
68
-
69
-
70
-
71
-
72
-
73
-
74
-
75
-
76
-
77
-
78
-
79
-
80
-
81
-
82
-
83
-
84
-
85
-
86
-
87
-
88
-
89
-
90
-
91
-
92
-
93
-
94
-
95
-
96
-
97
-
98
-
 99
99 -
 100
100 -
 101
101 -
 102
102 -
 103
103 -
 104
104 -
 105
105 -
 106
106 -
 107
107 -
 108
108 -
 109
109 -
 110
110 -
 111
111 -
 112
112 -
 113
113 -
 114
114 -
 115
115 -
 116
116 -
 117
117 -
 118
118 -
 119
119 -
120
-
121
-
122
-
123
-
124
-
125
-
126
-
127
-
128
-
129
-
130
-
131
-
132
-
133
-
134
-
135
-
136
-
137
-
138
-
139
-
140
-
141
-
142
-
143
-
144
-
145
-
146
-
147
-
148
-
149
-
150
-
151
-
152
-
153
-
154
-
155
-
156
-
157
-
158
-
159
-
160
-
161
-
162
-
163
-
164
-
165
-
166
-
167
-
168
-
169
-
170
-
171
-
172
-
173
-
174
-
175
-
176
-
177
-
178
-
179
-
180
-
181
-
182
-
183
-
184
-
185
-
186
-
187
-
188
-
189
-
190
-
191
-
192
-
193
-
194
-
195
-
196
-
197
-
198
-
199
-
200
-
201
-
202
-
203
-
204
-
205
-
206
-
207
-
208
-
209
-
210
-
211
-
212
-
213
-
214
-
215
-
216
-
217
-
218
-
219
-
220
-
221
-
222
-
223
-
224
-
225
-
226
-
227
-
228
-
229
-
230
-
231
-
232
-
233
-
234
-
235
-
236
-
237
-
238
-
239
-
240
-
241
-
242
-
243
-
244
-
245
-
246
-
247
-
248
-
249
-
250
-
251
-
252
-
253
-
254
-
255
-
256
 |
 |

Bank of America 2015 107
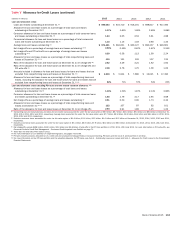
Table I Average Balances and Interest Rates – FTE Basis
2015 2014 2013
(Dollars in millions)
Average
Balance
Interest
Income/
Expense
Yield/
Rate
Average
Balance
Interest
Income/
Expense
Yield/
Rate
Average
Balance
Interest
Income/
Expense
Yield/
Rate
Earning assets
Interest-bearing deposits with the Federal Reserve, non-U.S.
central banks and other banks (1) $ 136,391 $ 369 0.27% $ 113,999 $ 308 0.27% $ 72,574 $182 0.25%
Time deposits placed and other short-term investments 9,556 147 1.53 11,032 170 1.54 16,066 187 1.16
Federal funds sold and securities borrowed or purchased under
agreements to resell 211,471 988 0.47 222,483 1,039 0.47 224,331 1,229 0.55
Trading account assets 137,837 4,547 3.30 145,686 4,716 3.24 168,998 4,879 2.89
Debt securities (2) 390,884 9,374 2.41 351,702 8,062 2.28 337,953 9,779 2.89
Loans and leases (3):
Residential mortgage 201,366 6,967 3.46 237,270 8,462 3.57 256,534 9,315 3.63
Home equity 81,070 2,984 3.68 89,705 3,340 3.72 100,264 3,835 3.82
U.S. credit card 88,244 8,085 9.16 88,962 8,313 9.34 90,369 8,792 9.73
Non-U.S. credit card 10,104 1,051 10.40 11,511 1,200 10.42 10,861 1,271 11.70
Direct/Indirect consumer (4) 84,585 2,040 2.41 82,409 2,099 2.55 82,907 2,370 2.86
Other consumer (5) 1,938 56 2.86 2,029 139 6.86 1,807 72 4.02
Total consumer 467,307 21,183 4.53 511,886 23,553 4.60 542,742 25,655 4.73
U.S. commercial 248,355 6,883 2.77 230,173 6,630 2.88 218,875 6,811 3.11
Commercial real estate (6) 52,136 1,521 2.92 47,525 1,432 3.01 42,345 1,391 3.29
Commercial lease financing 25,197 799 3.17 24,423 838 3.43 23,863 851 3.56
Non-U.S. commercial 89,188 2,008 2.25 89,894 2,196 2.44 90,816 2,083 2.29
Total commercial 414,876 11,211 2.70 392,015 11,096 2.83 375,899 11,136 2.96
Total loans and leases 882,183 32,394 3.67 903,901 34,649 3.83 918,641 36,791 4.00
Other earning assets 62,020 2,890 4.66 66,127 2,811 4.25 80,985 2,832 3.50
Total earning assets (7) 1,830,342 50,709 2.77 1,814,930 51,755 2.85 1,819,548 55,879 3.07
Cash and due from banks 28,921 27,079 36,440
Other assets, less allowance for loan and lease losses 300,878 303,581 307,525
Total assets $ 2,160,141 $2,145,590 $ 2,163,513
Interest-bearing liabilities
U.S. interest-bearing deposits:
Savings $ 46,498 $ 7 0.01% $ 46,270 $ 3 0.01% $ 43,868 $ 22 0.05%
NOW and money market deposit accounts 543,133 273 0.05 518,893 316 0.06 506,082 413 0.08
Consumer CDs and IRAs 54,679 162 0.30 66,797 264 0.40 79,913 472 0.59
Negotiable CDs, public funds and other deposits 29,976 95 0.32 31,507 108 0.34 26,553 117 0.44
Total U.S. interest-bearing deposits 674,286 537 0.08 663,467 691 0.10 656,416 1,024 0.16
Non-U.S. interest-bearing deposits:
Banks located in non-U.S. countries 4,473 31 0.70 8,744 61 0.69 12,431 69 0.56
Governments and official institutions 1,492 5 0.33 1,740 2 0.14 1,584 3 0.18
Time, savings and other 54,767 288 0.53 60,729 326 0.54 55,630 300 0.54
Total non-U.S. interest-bearing deposits 60,732 324 0.53 71,213 389 0.55 69,645 372 0.54
Total interest-bearing deposits 735,018 861 0.12 734,680 1,080 0.15 726,061 1,396 0.19
Federal funds purchased, securities loaned or sold under
agreements to repurchase and short-term borrowings 246,295 2,387 0.97 257,678 2,578 1.00 301,415 2,923 0.97
Trading account liabilities 76,772 1,343 1.75 87,152 1,576 1.81 88,323 1,638 1.85
Long-term debt (8) 240,059 5,958 2.48 253,607 5,700 2.25 263,417 6,798 2.58
Total interest-bearing liabilities (7) 1,298,144 10,549 0.81 1,333,117 10,934 0.82 1,379,216 12,755 0.92
Noninterest-bearing sources:
Noninterest-bearing deposits 420,842 389,527 363,674
Other liabilities 189,165 184,464 186,672
Shareholders’ equity 251,990 238,482 233,951
Total liabilities and shareholders’ equity $ 2,160,141 $ 2,145,590 $ 2,163,513
Net interest spread 1.96% 2.03% 2.15%
Impact of noninterest-bearing sources 0.24 0.22 0.22
Net interest income/yield on earning assets $ 40,160 2.20% $ 40,821 2.25% $ 43,124 2.37%
(1) Beginning in 2014, interest-bearing deposits placed with the Federal Reserve and certain non-U.S. central banks are included in earning assets. In prior periods, these balances were included with
cash and due from banks in the cash and cash equivalents line, consistent with the Consolidated Balance Sheet presentation. Prior periods have been reclassified to conform to current period
presentation.
(2) Yields on debt securities excluding the impact of market-related adjustments were 2.50 percent, 2.62 percent and 2.67 percent in 2015, 2014 and 2013, respectively. Yields on debt securities
excluding the impact of market-related adjustments are a non-GAAP financial measure. The Corporation believes the use of this non-GAAP financial measure provides additional clarity in assessing
its results.
(3) Nonperforming loans are included in the respective average loan balances. Income on these nonperforming loans is generally recognized on a cost recovery basis. PCI loans were recorded at fair
value upon acquisition and accrete interest income over the remaining life of the loan.
(4) Includes non-U.S. consumer loans of $4.0 billion, $4.4 billion and $6.7 billion in 2015, 2014 and 2013, respectively.
(5) Includes consumer finance loans of $619 million, $1.1 billion and $1.3 billion; consumer leases of $1.2 billion, $819 million and $354 million; and consumer overdrafts of $156 million, $149
million and $153 million in 2015, 2014 and 2013, respectively.
(6) Includes U.S. commercial real estate loans of $49.0 billion, $46.0 billion and $40.7 billion, and non-U.S. commercial real estate loans of $3.1 billion, $1.6 billion and $1.6 billion in 2015, 2014
and 2013, respectively.
(7) Interest income includes the impact of interest rate risk management contracts, which decreased interest income on the underlying assets by $59 million, $58 million and $205 million in 2015,
2014 and 2013, respectively. Interest expense includes the impact of interest rate risk management contracts, which decreased interest expense on the underlying liabilities by $2.4 billion, $2.5
billion and $2.4 billion in 2015, 2014 and 2013, respectively. For additional information, see Interest Rate Risk Management for Non-trading Activities on page 95.
(8) The yield on long-term debt excluding the $612 million adjustment on certain trust preferred securities was 2.23 percent for 2015. For more information, see Note 11 – Long-term Debt to the
Consolidated Financial Statements. The yield on long-term debt excluding the adjustment is a non-GAAP financial measure.