Bank of America 2015 Annual Report Download - page 164
Download and view the complete annual report
Please find page 164 of the 2015 Bank of America annual report below. You can navigate through the pages in the report by either clicking on the pages listed below, or by using the keyword search tool below to find specific information within the annual report.-
 1
1 -
2
-
3
-
4
-
5
-
6
-
7
-
8
-
9
-
10
-
11
-
12
-
13
-
14
-
15
-
16
-
17
-
18
-
19
-
20
-
21
-
22
-
23
-
24
-
25
-
26
-
27
-
28
-
29
-
30
-
31
-
32
-
33
-
34
-
35
-
36
-
37
-
38
-
39
-
40
-
41
-
42
-
43
-
44
-
45
-
46
-
47
-
48
-
49
-
50
-
51
-
52
-
53
-
54
-
55
-
56
-
57
-
58
-
59
-
60
-
61
-
62
-
63
-
64
-
65
-
66
-
67
-
68
-
69
-
70
-
71
-
72
-
73
-
74
-
75
-
76
-
77
-
78
-
79
-
80
-
81
-
82
-
83
-
84
-
85
-
86
-
87
-
88
-
89
-
90
-
91
-
92
-
93
-
94
-
95
-
96
-
97
-
98
-
99
-
100
-
101
-
102
-
103
-
104
-
105
-
106
-
107
-
108
-
109
-
110
-
111
-
112
-
113
-
114
-
115
-
116
-
117
-
118
-
119
-
120
-
121
-
122
-
123
-
124
-
125
-
126
-
127
-
128
-
129
-
130
-
131
-
132
-
133
-
134
-
135
-
136
-
137
-
138
-
139
-
140
-
141
-
142
-
143
-
144
-
145
-
146
-
147
-
148
-
149
-
150
-
151
-
152
-
153
-
 154
154 -
 155
155 -
 156
156 -
 157
157 -
 158
158 -
 159
159 -
 160
160 -
 161
161 -
 162
162 -
 163
163 -
 164
164 -
 165
165 -
 166
166 -
 167
167 -
 168
168 -
 169
169 -
 170
170 -
 171
171 -
 172
172 -
 173
173 -
 174
174 -
175
-
176
-
177
-
178
-
179
-
180
-
181
-
182
-
183
-
184
-
185
-
186
-
187
-
188
-
189
-
190
-
191
-
192
-
193
-
194
-
195
-
196
-
197
-
198
-
199
-
200
-
201
-
202
-
203
-
204
-
205
-
206
-
207
-
208
-
209
-
210
-
211
-
212
-
213
-
214
-
215
-
216
-
217
-
218
-
219
-
220
-
221
-
222
-
223
-
224
-
225
-
226
-
227
-
228
-
229
-
230
-
231
-
232
-
233
-
234
-
235
-
236
-
237
-
238
-
239
-
240
-
241
-
242
-
243
-
244
-
245
-
246
-
247
-
248
-
249
-
250
-
251
-
252
-
253
-
254
-
255
-
256
 |
 |

162 Bank of America 2015
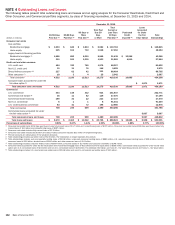
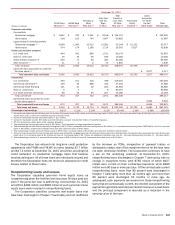
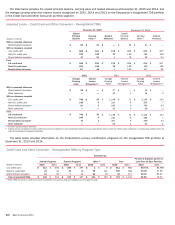
NOTE 4 Outstanding Loans and Leases
The following tables present total outstanding loans and leases and an aging analysis for the Consumer Real Estate, Credit Card and
Other Consumer, and Commercial portfolio segments, by class of financing receivables, at December 31, 2015 and 2014.
December 31, 2015
(Dollars in millions)
30-59 Days
Past Due (1)
60-89 Days
Past Due (1)
90 Days or
More
Past Due (2)
Total Past
Due 30
Days
or More
Total
Current or
Less Than
30 Days
Past Due (3)
Purchased
Credit-
impaired (4)
Loans
Accounted
for Under
the Fair
Value Option
Total
Outstandings
Consumer real estate
Core portfolio
Residential mortgage $ 1,603 $ 645 $ 3,834 $ 6,082 $ 139,763 $ 145,845
Home equity 225 104 719 1,048 47,216 48,264
Legacy Assets & Servicing portfolio
Residential mortgage (5) 1,656 890 6,019 8,565 21,435 $ 12,066 42,066
Home equity 310 163 1,030 1,503 21,562 4,619 27,684
Credit card and other consumer
U.S. credit card 454 332 789 1,575 88,027 89,602
Non-U.S. credit card 39 31 76 146 9,829 9,975
Direct/Indirect consumer (6) 227 62 42 331 88,464 88,795
Other consumer (7) 18 3 4 25 2,042 2,067
Total consumer 4,532 2,230 12,513 19,275 418,338 16,685 454,298
Consumer loans accounted for under the
fair value option (8) $ 1,871 1,871
Total consumer loans and leases 4,532 2,230 12,513 19,275 418,338 16,685 1,871 456,169
Commercial
U.S. commercial 444 148 332 924 251,847 252,771
Commercial real estate (9) 36 11 82 129 57,070 57,199
Commercial lease financing 169 32 22 223 27,147 27,370
Non-U.S. commercial 6 1 1 8 91,541 91,549
U.S. small business commercial 83 41 72 196 12,680 12,876
Total commercial 738 233 509 1,480 440,285 441,765
Commercial loans accounted for under
the fair value option (8) 5,067 5,067
Total commercial loans and leases 738 233 509 1,480 440,285 5,067 446,832
Total loans and leases $ 5,270 $ 2,463 $ 13,022 $ 20,755 $ 858,623 $ 16,685 $ 6,938 $ 903,001
Percentage of outstandings 0.59% 0.27% 1.44% 2.30% 95.08% 1.85%0.77% 100.00%
(1) Consumer real estate loans 30-59 days past due includes fully-insured loans of $1.7 billion and nonperforming loans of $379 million. Consumer real estate loans 60-89 days past due includes fully-
insured loans of $1.0 billion and nonperforming loans of $297 million.
(2) Consumer real estate includes fully-insured loans of $7.2 billion.
(3) Consumer real estate includes $3.0 billion and direct/indirect consumer includes $21 million of nonperforming loans.
(4) PCI loan amounts are shown gross of the valuation allowance.
(5) Total outstandings includes pay option loans of $2.3 billion. The Corporation no longer originates this product.
(6) Total outstandings includes auto and specialty lending loans of $42.6 billion, unsecured consumer lending loans of $886 million, U.S. securities-based lending loans of $39.8 billion, non-U.S.
consumer loans of $3.9 billion, student loans of $564 million and other consumer loans of $1.0 billion.
(7) Total outstandings includes consumer finance loans of $564 million, consumer leases of $1.4 billion and consumer overdrafts of $146 million.
(8) Consumer loans accounted for under the fair value option were residential mortgage loans of $1.6 billion and home equity loans of $250 million. Commercial loans accounted for under the fair value
option were U.S. commercial loans of $2.3 billion and non-U.S. commercial loans of $2.8 billion. For additional information, see Note 20 – Fair Value Measurements and Note 21 – Fair Value Option.
(9) Total outstandings includes U.S. commercial real estate loans of $53.6 billion and non-U.S. commercial real estate loans of $3.5 billion.