Bank of America 2015 Annual Report Download - page 120
Download and view the complete annual report
Please find page 120 of the 2015 Bank of America annual report below. You can navigate through the pages in the report by either clicking on the pages listed below, or by using the keyword search tool below to find specific information within the annual report.-
 1
1 -
2
-
3
-
4
-
5
-
6
-
7
-
8
-
9
-
10
-
11
-
12
-
13
-
14
-
15
-
16
-
17
-
18
-
19
-
20
-
21
-
22
-
23
-
24
-
25
-
26
-
27
-
28
-
29
-
30
-
31
-
32
-
33
-
34
-
35
-
36
-
37
-
38
-
39
-
40
-
41
-
42
-
43
-
44
-
45
-
46
-
47
-
48
-
49
-
50
-
51
-
52
-
53
-
54
-
55
-
56
-
57
-
58
-
59
-
60
-
61
-
62
-
63
-
64
-
65
-
66
-
67
-
68
-
69
-
70
-
71
-
72
-
73
-
74
-
75
-
76
-
77
-
78
-
79
-
80
-
81
-
82
-
83
-
84
-
85
-
86
-
87
-
88
-
89
-
90
-
91
-
92
-
93
-
94
-
95
-
96
-
97
-
98
-
99
-
100
-
101
-
102
-
103
-
104
-
105
-
106
-
107
-
108
-
109
-
 110
110 -
 111
111 -
 112
112 -
 113
113 -
 114
114 -
 115
115 -
 116
116 -
 117
117 -
 118
118 -
 119
119 -
 120
120 -
 121
121 -
 122
122 -
 123
123 -
 124
124 -
 125
125 -
 126
126 -
 127
127 -
 128
128 -
 129
129 -
 130
130 -
131
-
132
-
133
-
134
-
135
-
136
-
137
-
138
-
139
-
140
-
141
-
142
-
143
-
144
-
145
-
146
-
147
-
148
-
149
-
150
-
151
-
152
-
153
-
154
-
155
-
156
-
157
-
158
-
159
-
160
-
161
-
162
-
163
-
164
-
165
-
166
-
167
-
168
-
169
-
170
-
171
-
172
-
173
-
174
-
175
-
176
-
177
-
178
-
179
-
180
-
181
-
182
-
183
-
184
-
185
-
186
-
187
-
188
-
189
-
190
-
191
-
192
-
193
-
194
-
195
-
196
-
197
-
198
-
199
-
200
-
201
-
202
-
203
-
204
-
205
-
206
-
207
-
208
-
209
-
210
-
211
-
212
-
213
-
214
-
215
-
216
-
217
-
218
-
219
-
220
-
221
-
222
-
223
-
224
-
225
-
226
-
227
-
228
-
229
-
230
-
231
-
232
-
233
-
234
-
235
-
236
-
237
-
238
-
239
-
240
-
241
-
242
-
243
-
244
-
245
-
246
-
247
-
248
-
249
-
250
-
251
-
252
-
253
-
254
-
255
-
256
 |
 |

118 Bank of America 2015
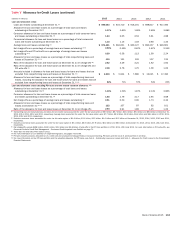
Table XI Quarterly Average Balances and Interest Rates – FTE Basis
Fourth Quarter 2015 Third Quarter 2015
(Dollars in millions)
Average
Balance
Interest
Income/
Expense
Yield/
Rate
Average
Balance
Interest
Income/
Expense
Yield/
Rate
Earning assets
Interest-bearing deposits with the Federal Reserve, non-U.S. central banks and other banks $ 148,102 $ 108 0.29% $ 145,174 $ 96 0.26%
Time deposits placed and other short-term investments 10,120 42 1.62 11,503 38 1.33
Federal funds sold and securities borrowed or purchased under agreements to resell 207,585 214 0.41 210,127 275 0.52
Trading account assets 134,797 1,141 3.37 140,484 1,170 3.31
Debt securities (1) 399,423 2,541 2.55 394,420 1,853 1.88
Loans and leases (2):
Residential mortgage 189,650 1,644 3.47 193,791 1,690 3.49
Home equity 77,109 715 3.69 79,715 730 3.64
U.S. credit card 88,623 2,045 9.15 88,201 2,033 9.15
Non-U.S. credit card 10,155 258 10.07 10,244 267 10.34
Direct/Indirect consumer (3) 87,858 530 2.40 85,975 515 2.38
Other consumer (4) 2,039 11 2.09 1,980 15 3.01
Total consumer 455,434 5,203 4.55 459,906 5,250 4.54
U.S. commercial 261,727 1,790 2.72 251,908 1,743 2.75
Commercial real estate (5) 56,126 408 2.89 53,605 384 2.84
Commercial lease financing 26,127 204 3.12 25,425 199 3.12
Non-U.S. commercial 92,447 530 2.27 91,997 514 2.22
Total commercial 436,427 2,932 2.67 422,935 2,840 2.67
Total loans and leases 891,861 8,135 3.63 882,841 8,090 3.64
Other earning assets 61,070 748 4.87 62,847 716 4.52
Total earning assets (6) 1,852,958 12,929 2.78 1,847,396 12,238 2.64
Cash and due from banks 29,503 27,730
Other assets, less allowance for loan and lease losses 298,011 293,867
Total assets $ 2,180,472 $2,168,993
Interest-bearing liabilities
U.S. interest-bearing deposits:
Savings $ 46,094 $ 1 0.01% $46,297 $ 2 0.02%
NOW and money market deposit accounts 558,441 68 0.05 545,741 67 0.05
Consumer CDs and IRAs 51,107 37 0.29 53,174 38 0.29
Negotiable CDs, public funds and other deposits 30,546 25 0.32 30,631 26 0.33
Total U.S. interest-bearing deposits 686,188 131 0.08 675,843 133 0.08
Non-U.S. interest-bearing deposits:
Banks located in non-U.S. countries 3,997 7 0.69 4,196 7 0.71
Governments and official institutions 1,687 2 0.37 1,654 1 0.33
Time, savings and other 55,965 71 0.51 53,793 73 0.53
Total non-U.S. interest-bearing deposits 61,649 80 0.52 59,643 81 0.54
Total interest-bearing deposits 747,837 211 0.11 735,486 214 0.12
Federal funds purchased, securities loaned or sold under agreements to repurchase and short-term
borrowings 231,650 519 0.89 257,323 597 0.92
Trading account liabilities 73,139 272 1.48 77,443 342 1.75
Long-term debt (7) 237,384 1,895 3.18 240,520 1,343 2.22
Total interest-bearing liabilities (6) 1,290,010 2,897 0.89 1,310,772 2,496 0.76
Noninterest-bearing sources:
Noninterest-bearing deposits 438,214 423,745
Other liabilities 195,123 180,583
Shareholders’ equity 257,125 253,893
Total liabilities and shareholders’ equity $ 2,180,472 $2,168,993
Net interest spread 1.89% 1.88%
Impact of noninterest-bearing sources 0.27 0.22
Net interest income/yield on earning assets $ 10,032 2.16% $ 9,742 2.10%
(1) Yields on debt securities excluding the impact of market-related adjustments were 2.47 percent, 2.50 percent, 2.48 percent and 2.54 percent in the fourth, third, second and first quarters of 2015,
respectively, and 2.53 percent in the fourth quarter of 2014. Yields on debt securities excluding the impact of market-related adjustments are a non-GAAP financial measure. The Corporation believes
the use of this non-GAAP financial measure provides additional clarity in assessing its results.
(2) Nonperforming loans are included in the respective average loan balances. Income on these nonperforming loans is generally recognized on a cost recovery basis. PCI loans were recorded at fair
value upon acquisition and accrete interest income over the remaining life of the loan.
(3) Includes non-U.S. consumer loans of $4.0 billion for each of the quarters of 2015 and $4.2 billion in the fourth quarter of 2014.
(4) Includes consumer finance loans of $578 million, $605 million, $632 million and $661 million in the fourth, third, second and first quarters of 2015, respectively, and $907 million in the fourth
quarter of 2014; consumer leases of $1.3 billion, $1.2 billion, $1.1 billion and $1.0 billion in the fourth, third, second and first quarters of 2015, respectively, and $965 million in the fourth quarter
of 2014; and consumer overdrafts of $174 million, $177 million, $131 million and $141 million in the fourth, third, second and first quarters of 2015, respectively, and $156 million in the fourth
quarter of 2014.
(5) Includes U.S. commercial real estate loans of $52.8 billion, $49.8 billion, $47.6 billion and $45.6 billion in the fourth, third, second and first quarters of 2015, respectively, and $45.1 billion in the
fourth quarter of 2014; and non-U.S. commercial real estate loans of $3.3 billion, $3.8 billion, $2.8 billion and $2.7 billion in the fourth, third, second and first quarters of 2015, respectively, and
$1.9 billion in the fourth quarter of 2014.
(6) Interest income includes the impact of interest rate risk management contracts, which decreased interest income on the underlying assets by $32 million, $8 million, $8 million and $11 million in
the fourth, third, second and first quarters of 2015, respectively, and $10 million in the fourth quarter of 2014. Interest expense includes the impact of interest rate risk management contracts,
which decreased interest expense on the underlying liabilities by $681 million, $590 million, $509 million and $582 million in the fourth, third, second and first quarters of 2015, respectively, and
$659 million in the fourth quarter of 2014. For additional information, see Interest Rate Risk Management for Non-trading Activities on page 95.
(7) The yield on long-term debt excluding the $612 million adjustment on certain trust preferred securities was 2.15 percent for the fourth quarter of 2015. For more information, see Note 11 – Long-
term Debt to the Consolidated Financial Statements. The yield on long-term debt excluding the adjustment is a non-GAAP financial measure.