Bank of America 2015 Annual Report Download - page 182
Download and view the complete annual report
Please find page 182 of the 2015 Bank of America annual report below. You can navigate through the pages in the report by either clicking on the pages listed below, or by using the keyword search tool below to find specific information within the annual report.-
 1
1 -
2
-
3
-
4
-
5
-
6
-
7
-
8
-
9
-
10
-
11
-
12
-
13
-
14
-
15
-
16
-
17
-
18
-
19
-
20
-
21
-
22
-
23
-
24
-
25
-
26
-
27
-
28
-
29
-
30
-
31
-
32
-
33
-
34
-
35
-
36
-
37
-
38
-
39
-
40
-
41
-
42
-
43
-
44
-
45
-
46
-
47
-
48
-
49
-
50
-
51
-
52
-
53
-
54
-
55
-
56
-
57
-
58
-
59
-
60
-
61
-
62
-
63
-
64
-
65
-
66
-
67
-
68
-
69
-
70
-
71
-
72
-
73
-
74
-
75
-
76
-
77
-
78
-
79
-
80
-
81
-
82
-
83
-
84
-
85
-
86
-
87
-
88
-
89
-
90
-
91
-
92
-
93
-
94
-
95
-
96
-
97
-
98
-
99
-
100
-
101
-
102
-
103
-
104
-
105
-
106
-
107
-
108
-
109
-
110
-
111
-
112
-
113
-
114
-
115
-
116
-
117
-
118
-
119
-
120
-
121
-
122
-
123
-
124
-
125
-
126
-
127
-
128
-
129
-
130
-
131
-
132
-
133
-
134
-
135
-
136
-
137
-
138
-
139
-
140
-
141
-
142
-
143
-
144
-
145
-
146
-
147
-
148
-
149
-
150
-
151
-
152
-
153
-
154
-
155
-
156
-
157
-
158
-
159
-
160
-
161
-
162
-
163
-
164
-
165
-
166
-
167
-
168
-
169
-
170
-
171
-
 172
172 -
 173
173 -
 174
174 -
 175
175 -
 176
176 -
 177
177 -
 178
178 -
 179
179 -
 180
180 -
 181
181 -
 182
182 -
 183
183 -
 184
184 -
 185
185 -
 186
186 -
 187
187 -
 188
188 -
 189
189 -
 190
190 -
 191
191 -
 192
192 -
193
-
194
-
195
-
196
-
197
-
198
-
199
-
200
-
201
-
202
-
203
-
204
-
205
-
206
-
207
-
208
-
209
-
210
-
211
-
212
-
213
-
214
-
215
-
216
-
217
-
218
-
219
-
220
-
221
-
222
-
223
-
224
-
225
-
226
-
227
-
228
-
229
-
230
-
231
-
232
-
233
-
234
-
235
-
236
-
237
-
238
-
239
-
240
-
241
-
242
-
243
-
244
-
245
-
246
-
247
-
248
-
249
-
250
-
251
-
252
-
253
-
254
-
255
-
256
 |
 |

180 Bank of America 2015
GNMA securities. For more information on MSRs, see Note 23 –
Mortgage Servicing Rights.
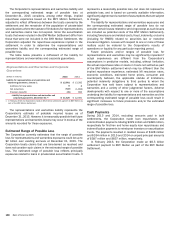
During 2015, the Corporation deconsolidated agency
residential mortgage securitization vehicles with total assets of
$4.5 billion following the sale of retained interests to third parties,
after which the Corporation no longer had the unilateral ability to
liquidate the vehicles. Gains on sale of $287 million were recorded
in other income in the Consolidated Statement of Income.
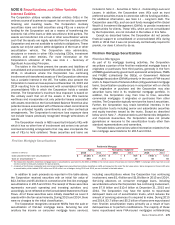
The table below summarizes select information related to first-
lien mortgage securitization trusts in which the Corporation held
a variable interest at December 31, 2015 and 2014.
First-lien Mortgage VIEs
Residential Mortgage
Non-agency
Agency Prime Subprime Alt-A
Commercial
Mortgage
December 31 December 31 December 31
(Dollars in millions) 2015 2014 2015 2014 2015 2014 2015 2014 2015 2014
Unconsolidated VIEs
Maximum loss exposure (1) $ 28,188 $ 14,918 $ 1,027 $ 1,288 $ 2,905 $ 3,167 $622 $ 710 $326 $ 352
On-balance sheet assets
Senior securities held (2):
Trading account assets $ 1,297 $ 584 $ 42 $3
$ 94 $ 14 $ 99 $ 81 $59 $ 54
Debt securities carried at fair value 24,369 13,473 613 816 2,479 2,811 340 383 —76
Held-to-maturity securities 2,507 837 ——————37 42
Subordinate securities held (2):
Trading account assets ——1—37 —2122 58
Debt securities carried at fair value ——12 12 3528 —54 58
Held-to-maturity securities ————————13 15
Residual interests held ———10 ————48 22
All other assets (3) 15 24 40 56 —1153 245 ——
Total retained positions $ 28,188 $ 14,918 $ 708 $ 897 $ 2,613 $ 2,831 $622 $ 710 $233 $ 325
Principal balance outstanding (4) $ 313,613 $ 397,055 $ 16,087 $ 20,167 $ 27,854 $ 32,592 $ 40,848 $ 50,054 $34,243 $ 20,593
Consolidated VIEs
Maximum loss exposure (1) $ 26,878 $ 38,345 $ 65 $ 77 $232 $ 206 $—
$—
$—$—
On-balance sheet assets
Trading account assets $ 1,101 $ 1,538 $—
$—
$188 $ 30 $—
$—
$—$—
Loans and leases 25,328 36,187 111 130 675 768 ————
Allowance for loan and lease losses —(2) ————————
All other assets 449 623 —654 15 ————
Total assets $ 26,878 $ 38,346 $ 111 $ 136 $917 $ 813 $—
$—
$—$—
On-balance sheet liabilities
Long-term debt $—
$1
$ 46 $ 56 $840 $ 770 $—
$—
$—$—
All other liabilities 1——3—13 ————
Total liabilities $1
$1
$ 46 $ 59 $840 $ 783 $—
$—
$—$—
(1) Maximum loss exposure includes obligations under loss-sharing reinsurance and other arrangements for non-agency residential mortgage and commercial mortgage securitizations, but excludes the
liability for representations and warranties obligations and corporate guarantees and also excludes servicing advances and other servicing rights and obligations. For additional information, see Note
7 – Representations and Warranties Obligations and Corporate Guarantees and Note 23 – Mortgage Servicing Rights.
(2) As a holder of these securities, the Corporation receives scheduled principal and interest payments. During 2015 and 2014, there were no OTTI losses recorded on those securities classified as
AFS debt securities.
(3) Not included in the table above are all other assets of $222 million and $635 million, representing the unpaid principal balance of mortgage loans eligible for repurchase from unconsolidated
residential mortgage securitization vehicles, principally guaranteed by GNMA, and all other liabilities of $222 million and $635 million, representing the principal amount that would be payable to the
securitization vehicles if the Corporation was to exercise the repurchase option, at December 31, 2015 and 2014.
(4) Principal balance outstanding includes loans the Corporation transferred with which it has continuing involvement, which may include servicing the loans.