Bank of America 2015 Annual Report Download - page 33
Download and view the complete annual report
Please find page 33 of the 2015 Bank of America annual report below. You can navigate through the pages in the report by either clicking on the pages listed below, or by using the keyword search tool below to find specific information within the annual report.-
 1
1 -
2
-
3
-
4
-
5
-
6
-
7
-
8
-
9
-
10
-
11
-
12
-
13
-
14
-
15
-
16
-
17
-
18
-
19
-
20
-
21
-
22
-
 23
23 -
 24
24 -
 25
25 -
 26
26 -
 27
27 -
 28
28 -
 29
29 -
 30
30 -
 31
31 -
 32
32 -
 33
33 -
 34
34 -
 35
35 -
 36
36 -
 37
37 -
 38
38 -
 39
39 -
 40
40 -
 41
41 -
 42
42 -
 43
43 -
44
-
45
-
46
-
47
-
48
-
49
-
50
-
51
-
52
-
53
-
54
-
55
-
56
-
57
-
58
-
59
-
60
-
61
-
62
-
63
-
64
-
65
-
66
-
67
-
68
-
69
-
70
-
71
-
72
-
73
-
74
-
75
-
76
-
77
-
78
-
79
-
80
-
81
-
82
-
83
-
84
-
85
-
86
-
87
-
88
-
89
-
90
-
91
-
92
-
93
-
94
-
95
-
96
-
97
-
98
-
99
-
100
-
101
-
102
-
103
-
104
-
105
-
106
-
107
-
108
-
109
-
110
-
111
-
112
-
113
-
114
-
115
-
116
-
117
-
118
-
119
-
120
-
121
-
122
-
123
-
124
-
125
-
126
-
127
-
128
-
129
-
130
-
131
-
132
-
133
-
134
-
135
-
136
-
137
-
138
-
139
-
140
-
141
-
142
-
143
-
144
-
145
-
146
-
147
-
148
-
149
-
150
-
151
-
152
-
153
-
154
-
155
-
156
-
157
-
158
-
159
-
160
-
161
-
162
-
163
-
164
-
165
-
166
-
167
-
168
-
169
-
170
-
171
-
172
-
173
-
174
-
175
-
176
-
177
-
178
-
179
-
180
-
181
-
182
-
183
-
184
-
185
-
186
-
187
-
188
-
189
-
190
-
191
-
192
-
193
-
194
-
195
-
196
-
197
-
198
-
199
-
200
-
201
-
202
-
203
-
204
-
205
-
206
-
207
-
208
-
209
-
210
-
211
-
212
-
213
-
214
-
215
-
216
-
217
-
218
-
219
-
220
-
221
-
222
-
223
-
224
-
225
-
226
-
227
-
228
-
229
-
230
-
231
-
232
-
233
-
234
-
235
-
236
-
237
-
238
-
239
-
240
-
241
-
242
-
243
-
244
-
245
-
246
-
247
-
248
-
249
-
250
-
251
-
252
-
253
-
254
-
255
-
256
 |
 |

•
•
•
•
•
•
•
•
•
•
•
•
•
•
•
•
•
•
•
•
•
•
•
•
•
Bank of America 2015 31
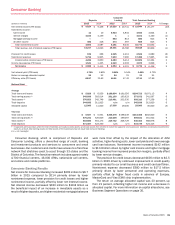
Consumer Banking
Deposits
Consumer
Lending Total Consumer Banking
(Dollars in millions) 2015 2014 2015 2014 2015 2014 % Change
Net interest income (FTE basis) $ 9,624 $ 9,436 $ 10,220 $ 10,741 $19,844 $ 20,177 (2)%
Noninterest income:
Card income 11 10 4,923 4,834 4,934 4,844 2
Service charges 4,100 4,159 114,101 4,160 (1)
Mortgage banking income ——883 813 883 813 9
All other income 482 418 374 397 856 815 5
Total noninterest income 4,593 4,587 6,181 6,045 10,774 10,632 1
Total revenue, net of interest expense (FTE basis) 14,217 14,023 16,401 16,786 30,618 30,809 (1)
Provision for credit losses 199 268 2,325 2,412 2,524 2,680 (6)
Noninterest expense 9,792 9,905 7,693 7,960 17,485 17,865 (2)
Income before income taxes (FTE basis) 4,226 3,850 6,383 6,414 10,609 10,264 3
Income tax expense (FTE basis) 1,541 1,435 2,329 2,393 3,870 3,828 1
Net income $ 2,685 $ 2,415 $ 4,054 $ 4,021 $ 6,739 $ 6,436 5
Net interest yield (FTE basis) 1.75% 1.83% 5.08%5.54% 3.46%3.73%
Return on average allocated capital 22 22 24 21 23 21
Efficiency ratio (FTE basis) 68.87 70.63 46.91 47.42 57.11 57.99
Balance Sheet
Average
Total loans and leases $ 5,829 $ 6,059 $ 198,894 $191,056 $ 204,723 $197,115 4
Total earning assets (1) 549,686 516,014 201,190 193,923 573,072 541,097 6
Total assets (1) 576,653 542,748 210,461 203,330 609,310 577,238 6
Total deposits 544,685 511,925 n/m n/m 545,839 512,820 6
Allocated capital 12,000 11,000 17,000 19,000 29,000 30,000 (3)
Year end
Total loans and leases $ 5,927 $ 5,951 $ 208,478 $196,049 $ 214,405 $202,000 6
Total earning assets (1) 576,241 526,849 210,208 199,097 599,631 551,922 9
Total assets (1) 603,580 554,173 219,702 208,729 636,464 588,878 8
Total deposits 571,467 523,350 n/m n/m 572,739 524,415 9
(1) In segments and businesses where the total of liabilities and equity exceeds assets, we allocate assets from All Other to match the segments’ and businesses’ liabilities and allocated shareholders’
equity. As a result, total earning assets and total assets of the businesses may not equal total Consumer Banking.
n/m = not meaningful
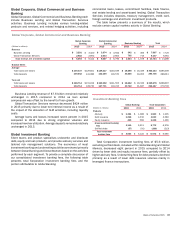
Consumer Banking, which is comprised of Deposits and
Consumer Lending, offers a diversified range of credit, banking
and investment products and services to consumers and small
businesses. Our customers and clients have access to a franchise
network that stretches coast to coast through 33 states and the
District of Columbia. The franchise network includes approximately
4,700 financial centers, 16,000 ATMs, nationwide call centers,
and online and mobile platforms.
Consumer Banking Results
Net income for Consumer Banking increased $303 million to $6.7
billion in 2015 compared to 2014 primarily driven by lower
noninterest expense, lower provision for credit losses and higher
noninterest income, partially offset by lower net interest income.
Net interest income decreased $333 million to $19.8 billion as
the beneficial impact of an increase in investable assets as a
result of higher deposits, and higher residential mortgage balances
were more than offset by the impact of the allocation of ALM
activities, higher funding costs, lower card yields and lower average
card loan balances. Noninterest income increased $142 million
to $10.8 billion driven by higher card income and higher mortgage
banking income from improved production margins, partially offset
by lower service charges.
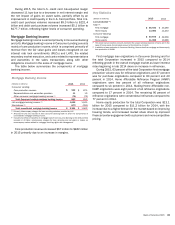
The provision for credit losses decreased $156 million to $2.5
billion in 2015 driven by continued improvement in credit quality
primarily related to our small business and credit card portfolios.
Noninterest expense decreased $380 million to $17.5 billion
primarily driven by lower personnel and operating expenses,
partially offset by higher fraud costs in advance of Europay,
MasterCard and Visa (EMV) chip implementation.
The return on average allocated capital was 23 percent, up
from 21 percent, reflecting higher net income and a decrease in
allocated capital. For more information on capital allocations, see
Business Segment Operations on page 30.