Bank of America 2015 Annual Report Download - page 89
Download and view the complete annual report
Please find page 89 of the 2015 Bank of America annual report below. You can navigate through the pages in the report by either clicking on the pages listed below, or by using the keyword search tool below to find specific information within the annual report.-
 1
1 -
2
-
3
-
4
-
5
-
6
-
7
-
8
-
9
-
10
-
11
-
12
-
13
-
14
-
15
-
16
-
17
-
18
-
19
-
20
-
21
-
22
-
23
-
24
-
25
-
26
-
27
-
28
-
29
-
30
-
31
-
32
-
33
-
34
-
35
-
36
-
37
-
38
-
39
-
40
-
41
-
42
-
43
-
44
-
45
-
46
-
47
-
48
-
49
-
50
-
51
-
52
-
53
-
54
-
55
-
56
-
57
-
58
-
59
-
60
-
61
-
62
-
63
-
64
-
65
-
66
-
67
-
68
-
69
-
70
-
71
-
72
-
73
-
74
-
75
-
76
-
77
-
78
-
 79
79 -
 80
80 -
 81
81 -
 82
82 -
 83
83 -
 84
84 -
 85
85 -
 86
86 -
 87
87 -
 88
88 -
 89
89 -
 90
90 -
 91
91 -
 92
92 -
 93
93 -
 94
94 -
 95
95 -
 96
96 -
 97
97 -
 98
98 -
 99
99 -
100
-
101
-
102
-
103
-
104
-
105
-
106
-
107
-
108
-
109
-
110
-
111
-
112
-
113
-
114
-
115
-
116
-
117
-
118
-
119
-
120
-
121
-
122
-
123
-
124
-
125
-
126
-
127
-
128
-
129
-
130
-
131
-
132
-
133
-
134
-
135
-
136
-
137
-
138
-
139
-
140
-
141
-
142
-
143
-
144
-
145
-
146
-
147
-
148
-
149
-
150
-
151
-
152
-
153
-
154
-
155
-
156
-
157
-
158
-
159
-
160
-
161
-
162
-
163
-
164
-
165
-
166
-
167
-
168
-
169
-
170
-
171
-
172
-
173
-
174
-
175
-
176
-
177
-
178
-
179
-
180
-
181
-
182
-
183
-
184
-
185
-
186
-
187
-
188
-
189
-
190
-
191
-
192
-
193
-
194
-
195
-
196
-
197
-
198
-
199
-
200
-
201
-
202
-
203
-
204
-
205
-
206
-
207
-
208
-
209
-
210
-
211
-
212
-
213
-
214
-
215
-
216
-
217
-
218
-
219
-
220
-
221
-
222
-
223
-
224
-
225
-
226
-
227
-
228
-
229
-
230
-
231
-
232
-
233
-
234
-
235
-
236
-
237
-
238
-
239
-
240
-
241
-
242
-
243
-
244
-
245
-
246
-
247
-
248
-
249
-
250
-
251
-
252
-
253
-
254
-
255
-
256
 |
 |
Bank of America 2015 87
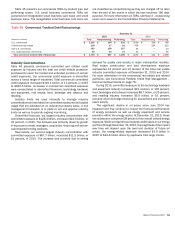
U.S. commercial, non-U.S. commercial and commercial lease
financing portfolios compared to December 31, 2014.
Also included within the second component of the allowance
for loan and lease losses are reserves to cover losses that are
incurred but, in our assessment, may not be adequately
represented in the historical loss data used in the loss forecast
models. For example, factors that we consider include, among
others, changes in lending policies and procedures, changes in
economic and business conditions, changes in the nature and size
of the portfolio, changes in portfolio concentrations, changes in
the volume and severity of past due loans and nonaccrual loans,
the effect of external factors such as competition, and legal and
regulatory requirements. We also consider factors that are
applicable to unique portfolio segments. For example, we consider
the risk of uncertainty in our loss forecasting models related to
junior-lien home equity loans that are current, but have first-lien
loans that we do not service that are 30 days or more past due.
In addition, we consider the increased risk of default associated
with our interest-only loans that have yet to enter the amortization
period. Further, we consider the inherent uncertainty in
mathematical models that are built upon historical data.
During 2015, the factors that impacted the allowance for loan
and lease losses included overall improvements in the credit
quality of the portfolios driven by continuing improvements in the
U.S. economy and labor markets, continuing proactive credit risk
management initiatives and the impact of recent higher credit
quality originations. Additionally, the resolution of uncertainties
through current recognition of net charge-offs has impacted the
amount of reserve needed in certain portfolios. Evidencing the
improvements in the U.S. economy and labor markets are modest
growth in consumer spending, improvements in unemployment
levels, increases in home prices and a decrease in the absolute
level and our share of national consumer bankruptcy filings. In
addition to these improvements, in the consumer portfolio, returns
to performing status, charge-offs, sales, paydowns and transfers
to foreclosed properties continued to outpace new nonaccrual
loans. Also impacting the allowance for loan and lease losses in
the commercial portfolio were growth in loan balances and higher
reservable criticized levels, particularly in the energy sector due
primarily to lower oil prices.
We monitor differences between estimated and actual incurred
loan and lease losses. This monitoring process includes periodic
assessments by senior management of loan and lease portfolios
and the models used to estimate incurred losses in those
portfolios.
Additions to, or reductions of, the allowance for loan and lease
losses generally are recorded through charges or credits to the
provision for credit losses. Credit exposures deemed to be
uncollectible are charged against the allowance for loan and lease
losses. Recoveries of previously charged off amounts are credited
to the allowance for loan and lease losses.
The allowance for loan and lease losses for the consumer
portfolio, as presented in Table 55, was $7.4 billion at
December 31, 2015, a decrease of $2.6 billion from
December 31, 2014. The decrease was primarily in the residential
mortgage, home equity and credit card portfolios. Reductions in
the residential mortgage and home equity portfolios were due to
improved home prices and lower delinquencies, a decrease in
consumer loan balances, as well as the utilization of reserves
recorded as a part of the DoJ Settlement. Further, the residential
mortgage and home equity allowance declined due to write-offs in
our PCI loan portfolio.
The decrease in the allowance related to the U.S. credit card
and unsecured consumer lending portfolios in Consumer Banking
was primarily due to improvement in delinquencies and more
generally in unemployment levels. For example, in the U.S. credit
card portfolio, accruing loans 30 days or more past due decreased
to $1.6 billion at December 31, 2015 from $1.7 billion (to 1.76
percent from 1.85 percent of outstanding U.S. credit card loans)
at December 31, 2014, and accruing loans 90 days or more past
due decreased to $789 million at December 31, 2015 from $866
million (to 0.88 percent from 0.94 percent of outstanding U.S.
credit card loans) at December 31, 2014. See Tables 23, 24, 31
and 33 for additional details on key credit statistics for the credit
card and other unsecured consumer lending portfolios.
The allowance for loan and lease losses for the commercial
portfolio, as presented in Table 55, was $4.8 billion at
December 31, 2015, an increase of $412 million from
December 31, 2014 with the increase attributable to loan growth
and higher reservable criticized levels. Commercial utilized
reservable criticized exposure increased to $16.5 billion at
December 31, 2015 from $11.6 billion (to 3.46 percent from 2.74
percent of total commercial utilized reservable exposure) at
December 31, 2014, largely due to downgrades in the energy
portfolio. Nonperforming commercial loans increased $99 million
from December 31, 2014 to $1.2 billion (to 0.27 percent from
0.29 percent of outstanding commercial loans) at December 31,
2015 largely in the energy sector. Commercial loans and leases
outstanding increased to $446.8 billion at December 31, 2015
from $392.8 billion at December 31, 2014. See Tables 37, 38
and 40 for additional details on key commercial credit statistics.
The allowance for loan and lease losses as a percentage of
total loans and leases outstanding was 1.37 percent at
December 31, 2015 compared to 1.65 percent at December 31,
2014. The decrease in the ratio was primarily due to improved
credit quality driven by improved economic conditions, write-offs
in the PCI loan portfolio and utilization of reserves related to the
DoJ Settlement. The December 31, 2015 and 2014 ratios above
include the PCI loan portfolio. Excluding the PCI loan portfolio, the
allowance for loan and lease losses as a percentage of total loans
and leases outstanding was 1.30 percent and 1.50 percent at
December 31, 2015 and 2014.