Bank of America 2015 Annual Report Download - page 80
Download and view the complete annual report
Please find page 80 of the 2015 Bank of America annual report below. You can navigate through the pages in the report by either clicking on the pages listed below, or by using the keyword search tool below to find specific information within the annual report.-
 1
1 -
2
-
3
-
4
-
5
-
6
-
7
-
8
-
9
-
10
-
11
-
12
-
13
-
14
-
15
-
16
-
17
-
18
-
19
-
20
-
21
-
22
-
23
-
24
-
25
-
26
-
27
-
28
-
29
-
30
-
31
-
32
-
33
-
34
-
35
-
36
-
37
-
38
-
39
-
40
-
41
-
42
-
43
-
44
-
45
-
46
-
47
-
48
-
49
-
50
-
51
-
52
-
53
-
54
-
55
-
56
-
57
-
58
-
59
-
60
-
61
-
62
-
63
-
64
-
65
-
66
-
67
-
68
-
69
-
 70
70 -
 71
71 -
 72
72 -
 73
73 -
 74
74 -
 75
75 -
 76
76 -
 77
77 -
 78
78 -
 79
79 -
 80
80 -
 81
81 -
 82
82 -
 83
83 -
 84
84 -
 85
85 -
 86
86 -
 87
87 -
 88
88 -
 89
89 -
 90
90 -
91
-
92
-
93
-
94
-
95
-
96
-
97
-
98
-
99
-
100
-
101
-
102
-
103
-
104
-
105
-
106
-
107
-
108
-
109
-
110
-
111
-
112
-
113
-
114
-
115
-
116
-
117
-
118
-
119
-
120
-
121
-
122
-
123
-
124
-
125
-
126
-
127
-
128
-
129
-
130
-
131
-
132
-
133
-
134
-
135
-
136
-
137
-
138
-
139
-
140
-
141
-
142
-
143
-
144
-
145
-
146
-
147
-
148
-
149
-
150
-
151
-
152
-
153
-
154
-
155
-
156
-
157
-
158
-
159
-
160
-
161
-
162
-
163
-
164
-
165
-
166
-
167
-
168
-
169
-
170
-
171
-
172
-
173
-
174
-
175
-
176
-
177
-
178
-
179
-
180
-
181
-
182
-
183
-
184
-
185
-
186
-
187
-
188
-
189
-
190
-
191
-
192
-
193
-
194
-
195
-
196
-
197
-
198
-
199
-
200
-
201
-
202
-
203
-
204
-
205
-
206
-
207
-
208
-
209
-
210
-
211
-
212
-
213
-
214
-
215
-
216
-
217
-
218
-
219
-
220
-
221
-
222
-
223
-
224
-
225
-
226
-
227
-
228
-
229
-
230
-
231
-
232
-
233
-
234
-
235
-
236
-
237
-
238
-
239
-
240
-
241
-
242
-
243
-
244
-
245
-
246
-
247
-
248
-
249
-
250
-
251
-
252
-
253
-
254
-
255
-
256
 |
 |

78 Bank of America 2015
Commercial Real Estate
Commercial real estate primarily includes commercial loans and
leases secured by non-owner-occupied real estate and is
dependent on the sale or lease of the real estate as the primary
source of repayment. The portfolio remains diversified across
property types and geographic regions. California represented the
largest state concentration at 21 percent and 22 percent of the
commercial real estate loans and leases portfolio at
December 31, 2015 and 2014. The commercial real estate
portfolio is predominantly managed in Global Banking and consists
of loans made primarily to public and private developers, and
commercial real estate firms. Outstanding loans increased $9.5
billion, or 20 percent, during 2015 due to new originations primarily
in major metropolitan markets.
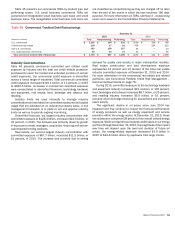
During 2015, we continued to see improvements in credit
quality in both the residential and non-residential portfolios. We
use a number of proactive risk mitigation initiatives to reduce
adversely rated exposure in the commercial real estate portfolio
including transfers of deteriorating exposures to management by
independent special asset officers and the pursuit of loan
restructurings or asset sales to achieve the best results for our
customers and the Corporation.
Nonperforming commercial real estate loans and foreclosed
properties decreased $280 million, or 72 percent, and reservable
criticized balances decreased $595 million, or 54 percent, during
2015. The decrease in reservable criticized balances was primarily
due to loan resolutions and strong commercial real estate
fundamentals throughout the year. Net recoveries were $5 million
in 2015 compared to net recoveries of $83 million in 2014.
Table 41 presents outstanding commercial real estate loans
by geographic region, based on the geographic location of the
collateral, and by property type.
Table 41 Outstanding Commercial Real Estate Loans
December 31
(Dollars in millions) 2015 2014
By Geographic Region
California $12,063 $ 10,352
Northeast 10,292 8,781
Southwest 7,789 6,570
Southeast 6,066 5,495
Midwest 3,780 2,867
Florida 3,330 2,520
Illinois 2,536 2,785
Midsouth 2,435 1,724
Northwest 2,327 2,151
Non-U.S. 3,549 2,494
Other (1) 3,032 1,943
Total outstanding commercial real estate loans $ 57,199 $ 47,682
By Property Type
Non-residential
Office $15,246 $ 13,306
Multi-family rental 8,956 8,382
Shopping centers/retail 8,594 7,969
Industrial/warehouse 5,501 4,550
Hotels/motels 5,415 3,578
Multi-use 3,003 1,943
Unsecured 2,056 1,194
Land and land development 539 490
Other 5,791 4,560
Total non-residential 55,101 45,972
Residential 2,098 1,710
Total outstanding commercial real estate loans $ 57,199 $ 47,682
(1) Includes unsecured loans to real estate investment trusts and national home builders whose portfolios of properties span multiple geographic regions and properties in the states of Colorado, Utah,
Hawaii, Wyoming and Montana.