Bank of America 2015 Annual Report Download - page 91
Download and view the complete annual report
Please find page 91 of the 2015 Bank of America annual report below. You can navigate through the pages in the report by either clicking on the pages listed below, or by using the keyword search tool below to find specific information within the annual report.-
 1
1 -
2
-
3
-
4
-
5
-
6
-
7
-
8
-
9
-
10
-
11
-
12
-
13
-
14
-
15
-
16
-
17
-
18
-
19
-
20
-
21
-
22
-
23
-
24
-
25
-
26
-
27
-
28
-
29
-
30
-
31
-
32
-
33
-
34
-
35
-
36
-
37
-
38
-
39
-
40
-
41
-
42
-
43
-
44
-
45
-
46
-
47
-
48
-
49
-
50
-
51
-
52
-
53
-
54
-
55
-
56
-
57
-
58
-
59
-
60
-
61
-
62
-
63
-
64
-
65
-
66
-
67
-
68
-
69
-
70
-
71
-
72
-
73
-
74
-
75
-
76
-
77
-
78
-
79
-
80
-
 81
81 -
 82
82 -
 83
83 -
 84
84 -
 85
85 -
 86
86 -
 87
87 -
 88
88 -
 89
89 -
 90
90 -
 91
91 -
 92
92 -
 93
93 -
 94
94 -
 95
95 -
 96
96 -
 97
97 -
 98
98 -
 99
99 -
 100
100 -
 101
101 -
102
-
103
-
104
-
105
-
106
-
107
-
108
-
109
-
110
-
111
-
112
-
113
-
114
-
115
-
116
-
117
-
118
-
119
-
120
-
121
-
122
-
123
-
124
-
125
-
126
-
127
-
128
-
129
-
130
-
131
-
132
-
133
-
134
-
135
-
136
-
137
-
138
-
139
-
140
-
141
-
142
-
143
-
144
-
145
-
146
-
147
-
148
-
149
-
150
-
151
-
152
-
153
-
154
-
155
-
156
-
157
-
158
-
159
-
160
-
161
-
162
-
163
-
164
-
165
-
166
-
167
-
168
-
169
-
170
-
171
-
172
-
173
-
174
-
175
-
176
-
177
-
178
-
179
-
180
-
181
-
182
-
183
-
184
-
185
-
186
-
187
-
188
-
189
-
190
-
191
-
192
-
193
-
194
-
195
-
196
-
197
-
198
-
199
-
200
-
201
-
202
-
203
-
204
-
205
-
206
-
207
-
208
-
209
-
210
-
211
-
212
-
213
-
214
-
215
-
216
-
217
-
218
-
219
-
220
-
221
-
222
-
223
-
224
-
225
-
226
-
227
-
228
-
229
-
230
-
231
-
232
-
233
-
234
-
235
-
236
-
237
-
238
-
239
-
240
-
241
-
242
-
243
-
244
-
245
-
246
-
247
-
248
-
249
-
250
-
251
-
252
-
253
-
254
-
255
-
256
 |
 |

Bank of America 2015 89
Table 54 Allowance for Credit Losses (continued)
(Dollars in millions) 2015 2014
Loan and allowance ratios:
Loans and leases outstanding at December 31 (4) $ 896,063 $ 872,710
Allowance for loan and lease losses as a percentage of total loans and leases outstanding at December 31 (4) 1.37%1.65%
Consumer allowance for loan and lease losses as a percentage of total consumer loans and leases outstanding at December 31 (5) 1.63 2.05
Commercial allowance for loan and lease losses as a percentage of total commercial loans and leases outstanding at December 31 (6) 1.10 1.15
Average loans and leases outstanding (4) $ 874,461 $ 894,001
Net charge-offs as a percentage of average loans and leases outstanding (4, 7) 0.50%0.49%
Net charge-offs and PCI write-offs as a percentage of average loans and leases outstanding (4) 0.59 0.58
Allowance for loan and lease losses as a percentage of total nonperforming loans and leases at December 31 (4, 8) 130 121
Ratio of the allowance for loan and lease losses at December 31 to net charge-offs (7) 2.82 3.29
Ratio of the allowance for loan and lease losses at December 31 to net charge-offs and PCI write-offs 2.38 2.78
Amounts included in allowance for loan and lease losses for loans and leases that are excluded from nonperforming loans and leases at
December 31 (9) $ 4,518 $5,944
Allowance for loan and lease losses as a percentage of total nonperforming loans and leases, excluding the allowance for loan and lease
losses for loans and leases that are excluded from nonperforming loans and leases at December 31 (4, 9) 82%71%
Loan and allowance ratios excluding PCI loans and the related valuation allowance: (10)
Allowance for loan and lease losses as a percentage of total loans and leases outstanding at December 31 (4) 1.30%1.50%
Consumer allowance for loan and lease losses as a percentage of total consumer loans and leases outstanding at December 31 (5) 1.50 1.79
Net charge-offs as a percentage of average loans and leases outstanding (4) 0.51 0.50
Allowance for loan and lease losses as a percentage of total nonperforming loans and leases at December 31 (4, 8) 122 107
Ratio of the allowance for loan and lease losses at December 31 to net charge-offs 2.64 2.91
(4) Outstanding loan and lease balances and ratios do not include loans accounted for under the fair value option of $6.9 billion and $8.7 billion at December 31, 2015 and 2014. Average loans
accounted for under the fair value option were $7.7 billion and $9.9 billion in 2015 and 2014.
(5) Excludes consumer loans accounted for under the fair value option of $1.9 billion and $2.1 billion at December 31, 2015 and 2014.
(6) Excludes commercial loans accounted for under the fair value option of $5.1 billion and $6.6 billion at December 31, 2015 and 2014.
(7) Net charge-offs exclude $808 million and $810 million of write-offs in the PCI loan portfolio in 2015 and 2014. For more information on PCI write-offs, see Consumer Portfolio Credit Risk Management
– Purchased Credit-impaired Loan Portfolio on page 71.
(8) For more information on our definition of nonperforming loans, see pages 73 and 80.
(9) Primarily includes amounts allocated to U.S. credit card and unsecured consumer lending portfolios in Consumer Banking, PCI loans and the non-U.S. credit card portfolio in All Other.
(10) For more information on the PCI loan portfolio and the valuation allowance for PCI loans, see Note 4 – Outstanding Loans and Leases and Note 5 – Allowance for Credit Losses to the Consolidated
Financial Statements.
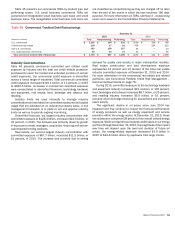
For reporting purposes, we allocate the allowance for credit losses across products. However, the allowance is generally available
to absorb any credit losses without restriction. Table 55 presents our allocation by product type.
Table 55 Allocation of the Allowance for Credit Losses by Product Type
December 31, 2015 December 31, 2014
(Dollars in millions) Amount
Percent of
Total
Percent of
Loans and
Leases
Outstanding (1) Amount
Percent of
Total
Percent of
Loans and
Leases
Outstanding (1)
Allowance for loan and lease losses
Residential mortgage $ 1,500 12.26% 0.80%$ 2,900 20.11% 1.34%
Home equity 2,414 19.73 3.18 3,035 21.05 3.54
U.S. credit card 2,927 23.93 3.27 3,320 23.03 3.61
Non-U.S. credit card 274 2.24 2.75 369 2.56 3.53
Direct/Indirect consumer 223 1.82 0.25 299 2.07 0.37
Other consumer 47 0.38 2.27 59 0.41 3.15
Total consumer 7,385 60.36 1.63 9,982 69.23 2.05
U.S. commercial (2) 2,964 24.23 1.12 2,619 18.16 1.12
Commercial real estate 967 7.90 1.69 1,016 7.05 2.13
Commercial lease financing 164 1.34 0.60 153 1.06 0.62
Non-U.S. commercial 754 6.17 0.82 649 4.50 0.81
Total commercial (3) 4,849 39.64 1.10 4,437 30.77 1.15
Allowance for loan and lease losses (4) 12,234 100.00% 1.37 14,419 100.00% 1.65
Reserve for unfunded lending commitments 646 528
Allowance for credit losses $ 12,880 $ 14,947
(1) Ratios are calculated as allowance for loan and lease losses as a percentage of loans and leases outstanding excluding loans accounted for under the fair value option. Consumer loans accounted
for under the fair value option included residential mortgage loans of $1.6 billion and $1.9 billion and home equity loans of $250 million and $196 million at December 31, 2015 and 2014.
Commercial loans accounted for under the fair value option included U.S. commercial loans of $2.3 billion and $1.9 billion and non-U.S. commercial loans of $2.8 billion and $4.7 billion at December
31, 2015 and 2014.
(2) Includes allowance for loan and lease losses for U.S. small business commercial loans of $507 million and $536 million at December 31, 2015 and 2014.
(3) Includes allowance for loan and lease losses for impaired commercial loans of $217 million and $159 million at December 31, 2015 and 2014.
(4) Includes $804 million and $1.7 billion of valuation allowance presented with the allowance for loan and lease losses related to PCI loans at December 31, 2015 and 2014.