Bank of America 2015 Annual Report Download - page 23
Download and view the complete annual report
Please find page 23 of the 2015 Bank of America annual report below. You can navigate through the pages in the report by either clicking on the pages listed below, or by using the keyword search tool below to find specific information within the annual report.-
 1
1 -
2
-
3
-
4
-
5
-
6
-
7
-
8
-
9
-
10
-
11
-
12
-
 13
13 -
 14
14 -
 15
15 -
 16
16 -
 17
17 -
 18
18 -
 19
19 -
 20
20 -
 21
21 -
 22
22 -
 23
23 -
 24
24 -
 25
25 -
 26
26 -
 27
27 -
 28
28 -
 29
29 -
 30
30 -
 31
31 -
 32
32 -
 33
33 -
34
-
35
-
36
-
37
-
38
-
39
-
40
-
41
-
42
-
43
-
44
-
45
-
46
-
47
-
48
-
49
-
50
-
51
-
52
-
53
-
54
-
55
-
56
-
57
-
58
-
59
-
60
-
61
-
62
-
63
-
64
-
65
-
66
-
67
-
68
-
69
-
70
-
71
-
72
-
73
-
74
-
75
-
76
-
77
-
78
-
79
-
80
-
81
-
82
-
83
-
84
-
85
-
86
-
87
-
88
-
89
-
90
-
91
-
92
-
93
-
94
-
95
-
96
-
97
-
98
-
99
-
100
-
101
-
102
-
103
-
104
-
105
-
106
-
107
-
108
-
109
-
110
-
111
-
112
-
113
-
114
-
115
-
116
-
117
-
118
-
119
-
120
-
121
-
122
-
123
-
124
-
125
-
126
-
127
-
128
-
129
-
130
-
131
-
132
-
133
-
134
-
135
-
136
-
137
-
138
-
139
-
140
-
141
-
142
-
143
-
144
-
145
-
146
-
147
-
148
-
149
-
150
-
151
-
152
-
153
-
154
-
155
-
156
-
157
-
158
-
159
-
160
-
161
-
162
-
163
-
164
-
165
-
166
-
167
-
168
-
169
-
170
-
171
-
172
-
173
-
174
-
175
-
176
-
177
-
178
-
179
-
180
-
181
-
182
-
183
-
184
-
185
-
186
-
187
-
188
-
189
-
190
-
191
-
192
-
193
-
194
-
195
-
196
-
197
-
198
-
199
-
200
-
201
-
202
-
203
-
204
-
205
-
206
-
207
-
208
-
209
-
210
-
211
-
212
-
213
-
214
-
215
-
216
-
217
-
218
-
219
-
220
-
221
-
222
-
223
-
224
-
225
-
226
-
227
-
228
-
229
-
230
-
231
-
232
-
233
-
234
-
235
-
236
-
237
-
238
-
239
-
240
-
241
-
242
-
243
-
244
-
245
-
246
-
247
-
248
-
249
-
250
-
251
-
252
-
253
-
254
-
255
-
256
 |
 |

Bank of America 2015 21
Capital Management
During 2015, we repurchased approximately $2.4 billion of
common stock, with an average price of $16.92 per share, in
connection with our 2015 Comprehensive Capital Analysis and
Review (CCAR) capital plan, which included a request to repurchase
$4.0 billion of common stock over five quarters beginning in the
second quarter of 2015, and to maintain the quarterly common
stock dividend at the current rate of $0.05 per share.
Based on the conditional non-objection we received from the
Federal Reserve on our 2015 CCAR submission, we were required
to resubmit our CCAR capital plan by September 30, 2015 and
address certain weaknesses the Federal Reserve identified in our
capital planning process. We have established plans and taken
actions which addressed the identified weaknesses, and we
resubmitted our CCAR capital plan on September 30, 2015. The
Federal Reserve announced that it did not object to our resubmitted
CCAR capital plan on December 10, 2015.
As an Advanced approaches institution, under Basel 3, we were
required to complete a qualification period (parallel run) to
demonstrate compliance with the Basel 3 Advanced approaches
capital framework to the satisfaction of U.S. banking regulators.
We received approval to begin using the Advanced approaches
capital framework to determine risk-based capital requirements
beginning in the fourth quarter of 2015. As previously disclosed,
with the approval to exit parallel run, U.S. banking regulators
requested modifications to certain internal analytical models
including the wholesale (e.g., commercial) credit models. All
requested modifications were incorporated, which increased our
risk-weighted assets, and are reflected in the risk-based ratios in
the fourth quarter of 2015. Having exited parallel run on October
1, 2015, we are required to report regulatory risk-based capital
ratios and risk-weighted assets under both the Standardized and
Advanced approaches. The approach that yields the lower ratio is
used to assess capital adequacy including under the Prompt
Corrective Action (PCA) framework and was the Advanced
approaches in the fourth quarter of 2015. For additional
information, see Capital Management on page 51.
Trust Preferred Securities
On December 29, 2015, the Corporation provided notice of the
redemption on January 29, 2016 of all trust preferred securities
of Merrill Lynch Preferred Capital Trust III, Merrill Lynch Preferred
Capital Trust IV and Merrill Lynch Preferred Capital Trust V (the
Trust Preferred Securities). In connection with the Corporation’s
acquisition of Merrill Lynch & Co., Inc. in 2009, the Corporation
recorded a discount to par value as purchase accounting
adjustments associated with the Trust Preferred Securities. The
Corporation recorded a $612 million charge to net interest income
related to the discount on these securities.
New Accounting Guidance on Recognition and
Measurement of Financial Instruments
In January 2016, the Financial Accounting Standards Board (FASB)
issued new accounting guidance on recognition and measurement
of financial instruments. The Corporation has early adopted,
retrospective to January 1, 2015, the provision that requires the
Corporation to present unrealized gains and losses resulting from
changes in the Corporation’s own credit spreads on liabilities
accounted for under the fair value option (referred to as debit
valuation adjustments, or DVA) in accumulated other
comprehensive income (OCI). The impact of the adoption was to
reclassify, as of January 1, 2015, unrealized DVA losses of $2.0
billion pretax ($1.2 billion after tax) from retained earnings to
accumulated OCI. Further, pretax unrealized DVA gains of $301
million, $301 million and $420 million were reclassified from other
income to accumulated OCI for the third, second and first quarters
of 2015, respectively. This had the effect of reducing net income
as previously reported for the aforementioned quarters by $187
million, $186 million and $260 million, or approximately $0.02
per share in each quarter. This change is reflected in consolidated
results and the Global Markets segment results. Results for 2014
were not subject to restatement under the provisions of the new
accounting guidance.
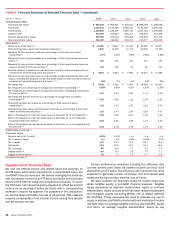
Selected Financial Data
Table 1 provides selected consolidated financial data for 2015 and 2014.
Table 1 Selected Financial Data
(Dollars in millions, except per share information) 2015 2014
Income statement
Revenue, net of interest expense (FTE basis) (1) $83,416 $ 85,116
Net income 15,888 4,833
Diluted earnings per common share 1.31 0.36
Dividends paid per common share 0.20 0.12
Performance ratios
Return on average assets 0.74%0.23%
Return on average tangible common shareholders’ equity (1) 9.11 2.52
Efficiency ratio (FTE basis) (1) 68.56 88.25
Balance sheet at year end
Total loans and leases $ 903,001 $ 881,391
Total assets 2,144,316 2,104,534
Total deposits 1,197,259 1,118,936
Total common shareholders’ equity 233,932 224,162
Total shareholders’ equity 256,205 243,471
(1) Fully taxable-equivalent (FTE) basis, return on average tangible common shareholders’ equity and the efficiency ratio are non-GAAP financial measures. Other companies may define or calculate these
measures differently. For additional information, see Supplemental Financial Data on page 28, and for corresponding reconciliations to GAAP financial measures, see Statistical Table XIII.