Bank of America 2015 Annual Report Download - page 83
Download and view the complete annual report
Please find page 83 of the 2015 Bank of America annual report below. You can navigate through the pages in the report by either clicking on the pages listed below, or by using the keyword search tool below to find specific information within the annual report.-
 1
1 -
2
-
3
-
4
-
5
-
6
-
7
-
8
-
9
-
10
-
11
-
12
-
13
-
14
-
15
-
16
-
17
-
18
-
19
-
20
-
21
-
22
-
23
-
24
-
25
-
26
-
27
-
28
-
29
-
30
-
31
-
32
-
33
-
34
-
35
-
36
-
37
-
38
-
39
-
40
-
41
-
42
-
43
-
44
-
45
-
46
-
47
-
48
-
49
-
50
-
51
-
52
-
53
-
54
-
55
-
56
-
57
-
58
-
59
-
60
-
61
-
62
-
63
-
64
-
65
-
66
-
67
-
68
-
69
-
70
-
71
-
72
-
 73
73 -
 74
74 -
 75
75 -
 76
76 -
 77
77 -
 78
78 -
 79
79 -
 80
80 -
 81
81 -
 82
82 -
 83
83 -
 84
84 -
 85
85 -
 86
86 -
 87
87 -
 88
88 -
 89
89 -
 90
90 -
 91
91 -
 92
92 -
 93
93 -
94
-
95
-
96
-
97
-
98
-
99
-
100
-
101
-
102
-
103
-
104
-
105
-
106
-
107
-
108
-
109
-
110
-
111
-
112
-
113
-
114
-
115
-
116
-
117
-
118
-
119
-
120
-
121
-
122
-
123
-
124
-
125
-
126
-
127
-
128
-
129
-
130
-
131
-
132
-
133
-
134
-
135
-
136
-
137
-
138
-
139
-
140
-
141
-
142
-
143
-
144
-
145
-
146
-
147
-
148
-
149
-
150
-
151
-
152
-
153
-
154
-
155
-
156
-
157
-
158
-
159
-
160
-
161
-
162
-
163
-
164
-
165
-
166
-
167
-
168
-
169
-
170
-
171
-
172
-
173
-
174
-
175
-
176
-
177
-
178
-
179
-
180
-
181
-
182
-
183
-
184
-
185
-
186
-
187
-
188
-
189
-
190
-
191
-
192
-
193
-
194
-
195
-
196
-
197
-
198
-
199
-
200
-
201
-
202
-
203
-
204
-
205
-
206
-
207
-
208
-
209
-
210
-
211
-
212
-
213
-
214
-
215
-
216
-
217
-
218
-
219
-
220
-
221
-
222
-
223
-
224
-
225
-
226
-
227
-
228
-
229
-
230
-
231
-
232
-
233
-
234
-
235
-
236
-
237
-
238
-
239
-
240
-
241
-
242
-
243
-
244
-
245
-
246
-
247
-
248
-
249
-
250
-
251
-
252
-
253
-
254
-
255
-
256
 |
 |

Bank of America 2015 81
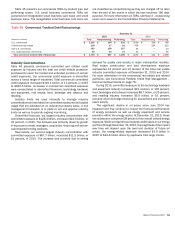
Table 45 presents our commercial TDRs by product type and
performing status. U.S. small business commercial TDRs are
comprised of renegotiated small business card loans and small
business loans. The renegotiated small business card loans are
not classified as nonperforming as they are charged off no later
than the end of the month in which the loan becomes 180 days
past due. For more information on TDRs, see Note 4 – Outstanding
Loans and Leases to the Consolidated Financial Statements.
Table 45 Commercial Troubled Debt Restructurings
December 31
2015 2014
(Dollars in millions) Total Nonperforming Performing Total Nonperforming Performing
U.S. commercial $ 1,225 $ 394 $831 $ 1,096 $ 308 $ 788
Commercial real estate 118 27 91 456 234 222
Non-U.S. commercial 363 136 227 43 — 43
U.S. small business commercial 29 10 19 35 — 35
Total commercial troubled debt restructurings $ 1,735 $ 567 $ 1,168 $ 1,630 $ 542 $ 1,088
Industry Concentrations
Table 46 presents commercial committed and utilized credit
exposure by industry and the total net credit default protection
purchased to cover the funded and unfunded portions of certain
credit exposures. Our commercial credit exposure is diversified
across a broad range of industries. Total commercial committed
credit exposure increased $110.1 billion, or 13 percent, in 2015
to $942.5 billion. Increases in commercial committed exposure
were concentrated in diversified financials, technology hardware
and equipment, real estate, food, beverage and tobacco and
retailing.
Industry limits are used internally to manage industry
concentrations and are based on committed exposures and capital
usage that are allocated on an industry-by-industry basis. A risk
management framework is in place to set and approve industry
limits as well as to provide ongoing monitoring.
Diversified financials, our largest industry concentration with
committed exposure of $128.4 billion, increased $24.9 billion, or
24 percent, in 2015. The increase was primarily driven by growth
in exposure to asset managers, acquisition financing and certain
asset-backed lending products.
Real estate, our second largest industry concentration with
committed exposure of $87.7 billion, increased $11.5 billion, or
15 percent, in 2015. The increase was primarily due to strong
demand for quality core assets in major metropolitan markets.
Real estate construction and land development exposure
represented 14 percent and 13 percent of the total real estate
industry committed exposure at December 31, 2015 and 2014.
For more information on the commercial real estate and related
portfolios, see Commercial Portfolio Credit Risk Management –
Commercial Real Estate on page 78.
During 2015, committed exposure to the technology hardware
and equipment industry increased $12.4 billion, or 100 percent,
food, beverages and tobacco increased $8.7 billion, or 25 percent,
and retailing industry increased $5.9 billion, or 10 percent,
primarily driven by bridge financing for acquisitions and increased
client activity.
The significant decline in oil prices since June 2014 has
impacted and may continue to impact the financial performance
of energy producers as well as energy equipment and service
providers within the energy sector. At December 31, 2015, these
two subsectors comprised 39 percent of our overall utilized energy
exposure. While we experienced modest credit losses in our energy
portfolio through December 31, 2015, the magnitude of the impact
over time will depend upon the level and duration of future oil
prices. Our energy-related exposure decreased $3.9 billion in
2015 to $43.8 billion driven by paydowns from large clients.