Bank of America 2015 Annual Report Download - page 36
Download and view the complete annual report
Please find page 36 of the 2015 Bank of America annual report below. You can navigate through the pages in the report by either clicking on the pages listed below, or by using the keyword search tool below to find specific information within the annual report.-
 1
1 -
2
-
3
-
4
-
5
-
6
-
7
-
8
-
9
-
10
-
11
-
12
-
13
-
14
-
15
-
16
-
17
-
18
-
19
-
20
-
21
-
22
-
23
-
24
-
25
-
 26
26 -
 27
27 -
 28
28 -
 29
29 -
 30
30 -
 31
31 -
 32
32 -
 33
33 -
 34
34 -
 35
35 -
 36
36 -
 37
37 -
 38
38 -
 39
39 -
 40
40 -
 41
41 -
 42
42 -
 43
43 -
 44
44 -
 45
45 -
 46
46 -
47
-
48
-
49
-
50
-
51
-
52
-
53
-
54
-
55
-
56
-
57
-
58
-
59
-
60
-
61
-
62
-
63
-
64
-
65
-
66
-
67
-
68
-
69
-
70
-
71
-
72
-
73
-
74
-
75
-
76
-
77
-
78
-
79
-
80
-
81
-
82
-
83
-
84
-
85
-
86
-
87
-
88
-
89
-
90
-
91
-
92
-
93
-
94
-
95
-
96
-
97
-
98
-
99
-
100
-
101
-
102
-
103
-
104
-
105
-
106
-
107
-
108
-
109
-
110
-
111
-
112
-
113
-
114
-
115
-
116
-
117
-
118
-
119
-
120
-
121
-
122
-
123
-
124
-
125
-
126
-
127
-
128
-
129
-
130
-
131
-
132
-
133
-
134
-
135
-
136
-
137
-
138
-
139
-
140
-
141
-
142
-
143
-
144
-
145
-
146
-
147
-
148
-
149
-
150
-
151
-
152
-
153
-
154
-
155
-
156
-
157
-
158
-
159
-
160
-
161
-
162
-
163
-
164
-
165
-
166
-
167
-
168
-
169
-
170
-
171
-
172
-
173
-
174
-
175
-
176
-
177
-
178
-
179
-
180
-
181
-
182
-
183
-
184
-
185
-
186
-
187
-
188
-
189
-
190
-
191
-
192
-
193
-
194
-
195
-
196
-
197
-
198
-
199
-
200
-
201
-
202
-
203
-
204
-
205
-
206
-
207
-
208
-
209
-
210
-
211
-
212
-
213
-
214
-
215
-
216
-
217
-
218
-
219
-
220
-
221
-
222
-
223
-
224
-
225
-
226
-
227
-
228
-
229
-
230
-
231
-
232
-
233
-
234
-
235
-
236
-
237
-
238
-
239
-
240
-
241
-
242
-
243
-
244
-
245
-
246
-
247
-
248
-
249
-
250
-
251
-
252
-
253
-
254
-
255
-
256
 |
 |

34 Bank of America 2015
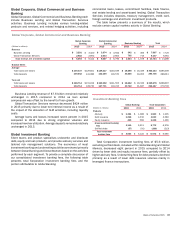
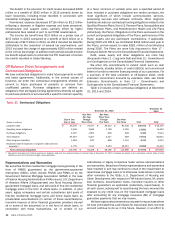
Global Wealth & Investment Management
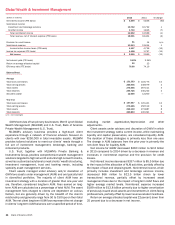
(Dollars in millions) 2015 2014 % Change
Net interest income (FTE basis) $ 5,499 $ 5,836 (6)%
Noninterest income:
Investment and brokerage services 10,792 10,722 1
All other income 1,710 1,846 (7)
Total noninterest income 12,502 12,568 (1)
Total revenue, net of interest expense (FTE basis) 18,001 18,404 (2)
Provision for credit losses 51 14 n/m
Noninterest expense 13,843 13,654 1
Income before income taxes (FTE basis) 4,107 4,736 (13)
Income tax expense (FTE basis) 1,498 1,767 (15)
Net income $ 2,609 $ 2,969 (12)
Net interest yield (FTE basis) 2.12%2.34%
Return on average allocated capital 22 25
Efficiency ratio (FTE basis) 76.90 74.19
Balance Sheet
Average
Total loans and leases $ 131,383 $ 119,775 10
Total earning assets 258,935 248,979 4
Total assets 275,866 267,511 3
Total deposits 244,725 240,242 2
Allocated capital 12,000 12,000 —
Year end
Total loans and leases $ 137,847 $ 125,431 10
Total earning assets 279,465 256,519 9
Total assets 296,139 274,887 8
Total deposits 260,893 245,391 6
n/m = not meaningful
GWIM consists of two primary businesses: Merrill Lynch Global
Wealth Management (MLGWM) and U.S. Trust, Bank of America
Private Wealth Management (U.S. Trust).
MLGWM’s advisory business provides a high-touch client
experience through a network of financial advisors focused on
clients with over $250,000 in total investable assets. MLGWM
provides tailored solutions to meet our clients’ needs through a
full set of investment management, brokerage, banking and
retirement products.
U.S. Trust, together with MLGWM’s Private Banking &
Investments Group, provides comprehensive wealth management
solutions targeted to high net worth and ultra high net worth clients,
as well as customized solutions to meet clients’ wealth structuring,
investment management, trust and banking needs, including
specialty asset management services.
Client assets managed under advisory and/or discretion of
GWIM are assets under management (AUM) and are typically held
in diversified portfolios. The majority of client AUM have an
investment strategy with a duration of greater than one year and
are, therefore, considered long-term AUM. Fees earned on long-
term AUM are calculated as a percentage of total AUM. The asset
management fees charged to clients are dependent on various
factors, but are generally driven by the breadth of the client’s
relationship and generally range from 50 to 150 bps on their total
AUM. The net client long-term AUM flows represent the net change
in clients’ long-term AUM balances over a specified period of time,
excluding market appreciation/depreciation and other
adjustments.
Client assets under advisory and discretion of GWIM in which
the investment strategy seeks current income, while maintaining
liquidity and capital preservation, are considered liquidity AUM.
The duration of these strategies is primarily less than one year.
The change in AUM balances from the prior year is primarily the
net client flows for liquidity AUM.
Net income for GWIM decreased $360 million to $2.6 billion
in 2015 compared to 2014 driven by a decrease in revenue and
increases in noninterest expense and the provision for credit
losses.
Net interest income decreased $337 million to $5.5 billion due
to the impact of the allocation of ALM activities, partially offset by
the impact of loan and deposit growth. Noninterest income, which
primarily includes investment and brokerage services income,
decreased $66 million to $12.5 billion driven by lower
transactional revenue, partially offset by increased asset
management fees due to the impact of long-term AUM flows and
higher average market levels. Noninterest expense increased
$189 million to $13.8 billion primarily due to higher amortization
of previously issued stock awards and investments in client-facing
professionals, partially offset by lower revenue-related incentives.
Return on average allocated capital was 22 percent, down from
25 percent due to a decrease in net income.