Bank of America 2015 Annual Report Download - page 42
Download and view the complete annual report
Please find page 42 of the 2015 Bank of America annual report below. You can navigate through the pages in the report by either clicking on the pages listed below, or by using the keyword search tool below to find specific information within the annual report.-
 1
1 -
2
-
3
-
4
-
5
-
6
-
7
-
8
-
9
-
10
-
11
-
12
-
13
-
14
-
15
-
16
-
17
-
18
-
19
-
20
-
21
-
22
-
23
-
24
-
25
-
26
-
27
-
28
-
29
-
30
-
31
-
 32
32 -
 33
33 -
 34
34 -
 35
35 -
 36
36 -
 37
37 -
 38
38 -
 39
39 -
 40
40 -
 41
41 -
 42
42 -
 43
43 -
 44
44 -
 45
45 -
 46
46 -
 47
47 -
 48
48 -
 49
49 -
 50
50 -
 51
51 -
 52
52 -
53
-
54
-
55
-
56
-
57
-
58
-
59
-
60
-
61
-
62
-
63
-
64
-
65
-
66
-
67
-
68
-
69
-
70
-
71
-
72
-
73
-
74
-
75
-
76
-
77
-
78
-
79
-
80
-
81
-
82
-
83
-
84
-
85
-
86
-
87
-
88
-
89
-
90
-
91
-
92
-
93
-
94
-
95
-
96
-
97
-
98
-
99
-
100
-
101
-
102
-
103
-
104
-
105
-
106
-
107
-
108
-
109
-
110
-
111
-
112
-
113
-
114
-
115
-
116
-
117
-
118
-
119
-
120
-
121
-
122
-
123
-
124
-
125
-
126
-
127
-
128
-
129
-
130
-
131
-
132
-
133
-
134
-
135
-
136
-
137
-
138
-
139
-
140
-
141
-
142
-
143
-
144
-
145
-
146
-
147
-
148
-
149
-
150
-
151
-
152
-
153
-
154
-
155
-
156
-
157
-
158
-
159
-
160
-
161
-
162
-
163
-
164
-
165
-
166
-
167
-
168
-
169
-
170
-
171
-
172
-
173
-
174
-
175
-
176
-
177
-
178
-
179
-
180
-
181
-
182
-
183
-
184
-
185
-
186
-
187
-
188
-
189
-
190
-
191
-
192
-
193
-
194
-
195
-
196
-
197
-
198
-
199
-
200
-
201
-
202
-
203
-
204
-
205
-
206
-
207
-
208
-
209
-
210
-
211
-
212
-
213
-
214
-
215
-
216
-
217
-
218
-
219
-
220
-
221
-
222
-
223
-
224
-
225
-
226
-
227
-
228
-
229
-
230
-
231
-
232
-
233
-
234
-
235
-
236
-
237
-
238
-
239
-
240
-
241
-
242
-
243
-
244
-
245
-
246
-
247
-
248
-
249
-
250
-
251
-
252
-
253
-
254
-
255
-
256
 |
 |

40 Bank of America 2015
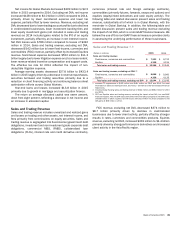
Legacy Assets & Servicing
(Dollars in millions) 2015 2014 % Change
Net interest income (FTE basis) $ 1,573 $ 1,520 3%
Noninterest income:
Mortgage banking income 1,658 1,045 59
All other income 199 111 79
Total noninterest income 1,857 1,156 61
Total revenue, net of interest expense (FTE basis) 3,430 2,676 28
Provision for credit losses 144 127 13
Noninterest expense 4,451 20,633 (78)
Loss before income taxes (FTE basis) (1,165)(18,084) (94)
Income tax benefit (FTE basis) (425) (4,974) (91)
Net loss $ (740) $ (13,110) (94)
Net interest yield (FTE basis) 3.82%4.04%
Balance Sheet
Average
Total loans and leases $ 29,885 $ 35,941 (17)
Total earning assets 41,160 37,593 9
Total assets 51,222 52,133 (2)
Allocated capital 24,000 17,000 41
Year end
Total loans and leases $ 26,521 $ 33,055 (20)
Total earning assets 37,783 33,923 11
Total assets 47,292 45,957 3
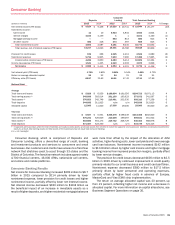
LAS is responsible for our mortgage servicing activities related
to residential first mortgage and home equity loans serviced for
others and loans held by the Corporation, including loans that have
been designated as the LAS Portfolios. The LAS Portfolios (both
owned and serviced), herein referred to as the Legacy Owned and
Legacy Serviced Portfolios, respectively (together, the Legacy
Portfolios), and as further defined below, include those loans
originated prior to January 1, 2011 that would not have been
originated under our established underwriting standards as of
December 31, 2010. For more information on our Legacy
Portfolios, see page 41. In addition, LAS is responsible for
managing certain legacy exposures related to mortgage
origination, sales and servicing activities (e.g., litigation,
representations and warranties). LAS also includes the financial
results of the home equity portfolio selected as part of the Legacy
Owned Portfolio and the results of MSR activities, including net
hedge results.
LAS includes certain revenues and expenses on loans serviced
for others, including owned loans serviced for Consumer Banking,
GWIM and All Other.
The net loss for LAS decreased $12.4 billion to $740 million
for 2015 compared to 2014 primarily driven by significantly lower
litigation expense, which is included in noninterest expense. Also
contributing to the decrease in the net loss was higher revenue,
primarily mortgage banking income, partially offset by higher
provision for credit losses. Mortgage banking income increased
$613 million primarily due to a lower representations and
warranties provision compared to 2014 and improved MSR net-
of-hedge performance, partially offset by lower servicing fees due
to a smaller servicing portfolio. The provision for credit losses
increased $17 million as the portfolio begins to stabilize. Also,
the provision for credit losses in 2014 included $400 million of
additional costs associated with the consumer relief portion of
the settlement with the DoJ. Noninterest expense decreased
$16.2 billion primarily due to a $14.4 billion decrease in litigation
expense. Excluding litigation, noninterest expense decreased $1.8
billion to $3.6 billion due to lower default-related staffing and other
default-related servicing expenses.
The increase in allocated capital for LAS reflects higher Basel
3 Advanced approaches operational risk capital than in 2014. For
more information on capital allocated to the business segments,
see Business Segment Operations on page 30.
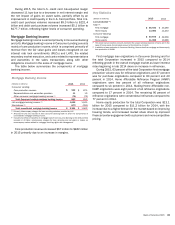
Servicing
LAS is responsible for all of our in-house servicing activities related
to the residential mortgage and home equity loan portfolios,
including owned loans and loans serviced for others (collectively,
the mortgage serviced portfolio). A portion of this portfolio has
been designated as the Legacy Serviced Portfolio, which
represented 25 percent, 26 percent and 30 percent of the total
mortgage serviced portfolio, as measured by unpaid principal
balance, at December 31, 2015, 2014 and 2013, respectively. In
addition, LAS is responsible for contracting with and overseeing
subservicing vendors who service loans on our behalf.
Servicing activities include collecting cash for principal,
interest and escrow payments from borrowers, disbursing
customer draws for lines of credit, accounting for and remitting
principal and interest payments to investors and escrow payments
to third parties, and responding to customer inquiries. Our home
retention efforts, including single point of contact resources, are
also part of our servicing activities, along with supervision of
foreclosures and property dispositions. Prior to foreclosure, LAS
evaluates various workout options in an effort to help our
customers avoid foreclosure.