Bank of America 2015 Annual Report Download - page 116
Download and view the complete annual report
Please find page 116 of the 2015 Bank of America annual report below. You can navigate through the pages in the report by either clicking on the pages listed below, or by using the keyword search tool below to find specific information within the annual report.-
 1
1 -
2
-
3
-
4
-
5
-
6
-
7
-
8
-
9
-
10
-
11
-
12
-
13
-
14
-
15
-
16
-
17
-
18
-
19
-
20
-
21
-
22
-
23
-
24
-
25
-
26
-
27
-
28
-
29
-
30
-
31
-
32
-
33
-
34
-
35
-
36
-
37
-
38
-
39
-
40
-
41
-
42
-
43
-
44
-
45
-
46
-
47
-
48
-
49
-
50
-
51
-
52
-
53
-
54
-
55
-
56
-
57
-
58
-
59
-
60
-
61
-
62
-
63
-
64
-
65
-
66
-
67
-
68
-
69
-
70
-
71
-
72
-
73
-
74
-
75
-
76
-
77
-
78
-
79
-
80
-
81
-
82
-
83
-
84
-
85
-
86
-
87
-
88
-
89
-
90
-
91
-
92
-
93
-
94
-
95
-
96
-
97
-
98
-
99
-
100
-
101
-
102
-
103
-
104
-
105
-
 106
106 -
 107
107 -
 108
108 -
 109
109 -
 110
110 -
 111
111 -
 112
112 -
 113
113 -
 114
114 -
 115
115 -
 116
116 -
 117
117 -
 118
118 -
 119
119 -
 120
120 -
 121
121 -
 122
122 -
 123
123 -
 124
124 -
 125
125 -
 126
126 -
127
-
128
-
129
-
130
-
131
-
132
-
133
-
134
-
135
-
136
-
137
-
138
-
139
-
140
-
141
-
142
-
143
-
144
-
145
-
146
-
147
-
148
-
149
-
150
-
151
-
152
-
153
-
154
-
155
-
156
-
157
-
158
-
159
-
160
-
161
-
162
-
163
-
164
-
165
-
166
-
167
-
168
-
169
-
170
-
171
-
172
-
173
-
174
-
175
-
176
-
177
-
178
-
179
-
180
-
181
-
182
-
183
-
184
-
185
-
186
-
187
-
188
-
189
-
190
-
191
-
192
-
193
-
194
-
195
-
196
-
197
-
198
-
199
-
200
-
201
-
202
-
203
-
204
-
205
-
206
-
207
-
208
-
209
-
210
-
211
-
212
-
213
-
214
-
215
-
216
-
217
-
218
-
219
-
220
-
221
-
222
-
223
-
224
-
225
-
226
-
227
-
228
-
229
-
230
-
231
-
232
-
233
-
234
-
235
-
236
-
237
-
238
-
239
-
240
-
241
-
242
-
243
-
244
-
245
-
246
-
247
-
248
-
249
-
250
-
251
-
252
-
253
-
254
-
255
-
256
 |
 |

114 Bank of America 2015
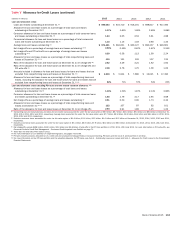
Table VI Allocation of the Allowance for Credit Losses by Product Type
December 31
2015 2014 2013 2012 2011
(Dollars in millions) Amount
Percent
of Total Amount
Percent
of Total Amount
Percent
of Total Amount
Percent
of Total Amount
Percent
of Total
Allowance for loan and lease losses
Residential mortgage $ 1,500 12.26% $ 2,900 20.11% $ 4,084 23.43% $ 7,088 29.31% $ 7,985 23.64%
Home equity 2,414 19.73 3,035 21.05 4,434 25.44 7,845 32.45 13,094 38.76
U.S. credit card 2,927 23.93 3,320 23.03 3,930 22.55 4,718 19.51 6,322 18.71
Non-U.S. credit card 274 2.24 369 2.56 459 2.63 600 2.48 946 2.80
Direct/Indirect consumer 223 1.82 299 2.07 417 2.39 718 2.97 1,153 3.41
Other consumer 47 0.38 59 0.41 99 0.58 104 0.43 148 0.44
Total consumer 7,385 60.36 9,982 69.23 13,423 77.02 21,073 87.15 29,648 87.76
U.S. commercial (1) 2,964 24.23 2,619 18.16 2,394 13.74 1,885 7.80 2,441 7.23
Commercial real estate 967 7.90 1,016 7.05 917 5.26 846 3.50 1,349 3.99
Commercial lease financing 164 1.34 153 1.06 118 0.68 78 0.32 92 0.27
Non-U.S. commercial 754 6.17 649 4.50 576 3.30 297 1.23 253 0.75
Total commercial (2) 4,849 39.64 4,437 30.77 4,005 22.98 3,106 12.85 4,135 12.24
Allowance for loan and lease losses (3) 12,234 100.00% 14,419 100.00% 17,428 100.00% 24,179 100.00% 33,783 100.00%
Reserve for unfunded lending commitments 646 528 484 513 714
Allowance for credit losses $ 12,880 $ 14,947 $ 17,912 $ 24,692 $ 34,497
(1) Includes allowance for loan and lease losses for U.S. small business commercial loans of $507 million, $536 million, $462 million, $642 million and $893 million at December 31, 2015, 2014,
2013, 2012 and 2011, respectively.
(2) Includes allowance for loan and lease losses for impaired commercial loans of $217 million, $159 million, $277 million, $475 million and $545 million at December 31, 2015, 2014, 2013, 2012
and 2011, respectively.
(3) Includes $804 million, $1.7 billion, $2.5 billion, $5.5 billion and $8.5 billion of valuation allowance presented with the allowance for loan and lease losses related to PCI loans at December 31,
2015, 2014, 2013, 2012 and 2011, respectively.
Table VII Selected Loan Maturity Data (1, 2)
December 31, 2015
(Dollars in millions)
Due in One
Year or Less
Due After
One Year
Through
Five Years
Due After
Five Years Total
U.S. commercial $ 74,624 $ 149,456 $ 43,837 $ 267,917
U.S. commercial real estate 10,417 39,495 3,738 53,650
Non-U.S. and other (3) 64,078 27,646 6,171 97,895
Total selected loans $ 149,119 $ 216,597 $ 53,746 $ 419,462
Percent of total 36% 51% 13% 100%
Sensitivity of selected loans to changes in interest rates for loans due after one year:
Fixed interest rates $ 16,216 $ 27,338
Floating or adjustable interest rates 200,381 26,408
Total $ 216,597 $ 53,746
(1) Loan maturities are based on the remaining maturities under contractual terms.
(2) Includes loans accounted for under the fair value option.
(3) Loan maturities include non-U.S. commercial and commercial real estate loans.