Bank of America 2015 Annual Report Download - page 35
Download and view the complete annual report
Please find page 35 of the 2015 Bank of America annual report below. You can navigate through the pages in the report by either clicking on the pages listed below, or by using the keyword search tool below to find specific information within the annual report.-
 1
1 -
2
-
3
-
4
-
5
-
6
-
7
-
8
-
9
-
10
-
11
-
12
-
13
-
14
-
15
-
16
-
17
-
18
-
19
-
20
-
21
-
22
-
23
-
24
-
 25
25 -
 26
26 -
 27
27 -
 28
28 -
 29
29 -
 30
30 -
 31
31 -
 32
32 -
 33
33 -
 34
34 -
 35
35 -
 36
36 -
 37
37 -
 38
38 -
 39
39 -
 40
40 -
 41
41 -
 42
42 -
 43
43 -
 44
44 -
 45
45 -
46
-
47
-
48
-
49
-
50
-
51
-
52
-
53
-
54
-
55
-
56
-
57
-
58
-
59
-
60
-
61
-
62
-
63
-
64
-
65
-
66
-
67
-
68
-
69
-
70
-
71
-
72
-
73
-
74
-
75
-
76
-
77
-
78
-
79
-
80
-
81
-
82
-
83
-
84
-
85
-
86
-
87
-
88
-
89
-
90
-
91
-
92
-
93
-
94
-
95
-
96
-
97
-
98
-
99
-
100
-
101
-
102
-
103
-
104
-
105
-
106
-
107
-
108
-
109
-
110
-
111
-
112
-
113
-
114
-
115
-
116
-
117
-
118
-
119
-
120
-
121
-
122
-
123
-
124
-
125
-
126
-
127
-
128
-
129
-
130
-
131
-
132
-
133
-
134
-
135
-
136
-
137
-
138
-
139
-
140
-
141
-
142
-
143
-
144
-
145
-
146
-
147
-
148
-
149
-
150
-
151
-
152
-
153
-
154
-
155
-
156
-
157
-
158
-
159
-
160
-
161
-
162
-
163
-
164
-
165
-
166
-
167
-
168
-
169
-
170
-
171
-
172
-
173
-
174
-
175
-
176
-
177
-
178
-
179
-
180
-
181
-
182
-
183
-
184
-
185
-
186
-
187
-
188
-
189
-
190
-
191
-
192
-
193
-
194
-
195
-
196
-
197
-
198
-
199
-
200
-
201
-
202
-
203
-
204
-
205
-
206
-
207
-
208
-
209
-
210
-
211
-
212
-
213
-
214
-
215
-
216
-
217
-
218
-
219
-
220
-
221
-
222
-
223
-
224
-
225
-
226
-
227
-
228
-
229
-
230
-
231
-
232
-
233
-
234
-
235
-
236
-
237
-
238
-
239
-
240
-
241
-
242
-
243
-
244
-
245
-
246
-
247
-
248
-
249
-
250
-
251
-
252
-
253
-
254
-
255
-
256
 |
 |

Bank of America 2015 33
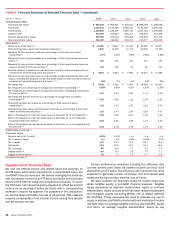
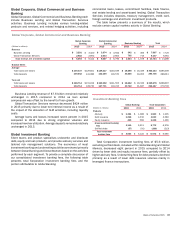
During 2015, the total U.S. credit card risk-adjusted margin
decreased 11 bps due to a decrease in net interest margin and
the net impact of gains on asset sales, partially offset by an
improvement in credit quality in the U.S. Card portfolio. Total U.S.
credit card purchase volumes increased $9.3 billion to $221.4
billion and debit card purchase volumes increased $5.1 billion to
$277.7 billion, reflecting higher levels of consumer spending.
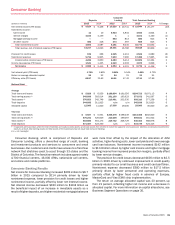
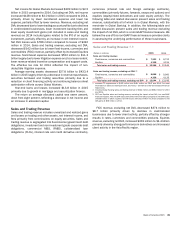
Mortgage Banking Income
Mortgage banking income is earned primarily in Consumer Banking
and LAS. Mortgage banking income in Consumer Lending consists
mainly of core production income, which is comprised primarily of
revenue from the fair value gains and losses recognized on our
interest rate lock commitments (IRLCs) and LHFS, the related
secondary market execution, and costs related to representations
and warranties in the sales transactions along with other
obligations incurred in the sales of mortgage loans.
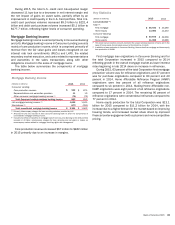
The table below summarizes the components of mortgage
banking income.
Mortgage Banking Income
(Dollars in millions) 2015 2014
Consumer Lending:
Core production revenue $ 942 $ 875
Representations and warranties provision 11 10
Other consumer mortgage banking income (1) (70) (72)
Total Consumer Lending mortgage banking income 883 813
LAS mortgage banking income (2) 1,658 1,045
Eliminations (3) (177) (295)
Total consolidated mortgage banking income $ 2,364 $ 1,563
(1) Primarily intercompany charges for loan servicing activities provided by LAS.
(2) Amounts for LAS are included in this Consumer Banking table to show the components of
consolidated mortgage banking income.
(3) Includes the effect of transfers of mortgage loans from Consumer Banking to the ALM portfolio
included in All Other, intercompany charges for loan servicing and net gains or losses on
intercompany trades related to mortgage servicing rights risk management.
Core production revenue increased $67 million to $942 million
in 2015 primarily due to an increase in margins.
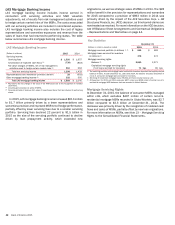
Key Statistics
(Dollars in millions) 2015 2014
Loan production (1):
Total (2):
First mortgage $ 56,930 $ 43,290
Home equity 13,060 11,233
Consumer Banking:
First mortgage $ 40,878 $ 32,339
Home equity 11,988 10,286
(1) The above loan production amounts represent the unpaid principal balance of loans and in the
case of home equity, the principal amount of the total line of credit.
(2) In addition to loan production in Consumer Banking, there is also first mortgage and home equity
loan production in GWIM.
First mortgage loan originations in Consumer Banking and for
the total Corporation increased in 2015 compared to 2014
reflecting growth in the overall mortgage market as lower interest
rates beginning in late 2014 drove an increase in refinances.
During 2015, 63 percent of the total Corporation first mortgage
production volume was for refinance originations and 37 percent
was for purchase originations compared to 60 percent and 40
percent in 2014. Home Affordable Refinance Program (HARP)
originations were two percent of all refinance originations
compared to six percent in 2014. Making Home Affordable non-
HARP originations were eight percent of all refinance originations
compared to 17 percent in 2014. The remaining 90 percent of
refinance originations were conventional refinances compared to
77 percent in 2014.
Home equity production for the total Corporation was $13.1
billion for 2015 compared to $11.2 billion for 2014, with the
increase due to a higher demand in the market based on improving
housing trends, and increased market share driven by improved
financial center engagement with customers and more competitive
pricing.