Bank of America 2015 Annual Report Download - page 158
Download and view the complete annual report
Please find page 158 of the 2015 Bank of America annual report below. You can navigate through the pages in the report by either clicking on the pages listed below, or by using the keyword search tool below to find specific information within the annual report.-
 1
1 -
2
-
3
-
4
-
5
-
6
-
7
-
8
-
9
-
10
-
11
-
12
-
13
-
14
-
15
-
16
-
17
-
18
-
19
-
20
-
21
-
22
-
23
-
24
-
25
-
26
-
27
-
28
-
29
-
30
-
31
-
32
-
33
-
34
-
35
-
36
-
37
-
38
-
39
-
40
-
41
-
42
-
43
-
44
-
45
-
46
-
47
-
48
-
49
-
50
-
51
-
52
-
53
-
54
-
55
-
56
-
57
-
58
-
59
-
60
-
61
-
62
-
63
-
64
-
65
-
66
-
67
-
68
-
69
-
70
-
71
-
72
-
73
-
74
-
75
-
76
-
77
-
78
-
79
-
80
-
81
-
82
-
83
-
84
-
85
-
86
-
87
-
88
-
89
-
90
-
91
-
92
-
93
-
94
-
95
-
96
-
97
-
98
-
99
-
100
-
101
-
102
-
103
-
104
-
105
-
106
-
107
-
108
-
109
-
110
-
111
-
112
-
113
-
114
-
115
-
116
-
117
-
118
-
119
-
120
-
121
-
122
-
123
-
124
-
125
-
126
-
127
-
128
-
129
-
130
-
131
-
132
-
133
-
134
-
135
-
136
-
137
-
138
-
139
-
140
-
141
-
142
-
143
-
144
-
145
-
146
-
147
-
 148
148 -
 149
149 -
 150
150 -
 151
151 -
 152
152 -
 153
153 -
 154
154 -
 155
155 -
 156
156 -
 157
157 -
 158
158 -
 159
159 -
 160
160 -
 161
161 -
 162
162 -
 163
163 -
 164
164 -
 165
165 -
 166
166 -
 167
167 -
 168
168 -
169
-
170
-
171
-
172
-
173
-
174
-
175
-
176
-
177
-
178
-
179
-
180
-
181
-
182
-
183
-
184
-
185
-
186
-
187
-
188
-
189
-
190
-
191
-
192
-
193
-
194
-
195
-
196
-
197
-
198
-
199
-
200
-
201
-
202
-
203
-
204
-
205
-
206
-
207
-
208
-
209
-
210
-
211
-
212
-
213
-
214
-
215
-
216
-
217
-
218
-
219
-
220
-
221
-
222
-
223
-
224
-
225
-
226
-
227
-
228
-
229
-
230
-
231
-
232
-
233
-
234
-
235
-
236
-
237
-
238
-
239
-
240
-
241
-
242
-
243
-
244
-
245
-
246
-
247
-
248
-
249
-
250
-
251
-
252
-
253
-
254
-
255
-
256
 |
 |

156 Bank of America 2015
Valuation Adjustments on Derivatives
The Corporation records credit risk valuation adjustments on
derivatives in order to properly reflect the credit quality of the
counterparties and its own credit quality. The Corporation
calculates valuation adjustments on derivatives based on a
modeled expected exposure that incorporates current market risk
factors. The exposure also takes into consideration credit
mitigants such as enforceable master netting agreements and
collateral. CDS spread data is used to estimate the default
probabilities and severities that are applied to the exposures.
Where no observable credit default data is available for
counterparties, the Corporation uses proxies and other market
data to estimate default probabilities and severity.
Valuation adjustments on derivatives are affected by changes
in market spreads, non-credit related market factors such as
interest rate and currency changes that affect the expected
exposure, and other factors like changes in collateral
arrangements and partial payments. Credit spreads and non-credit
factors can move independently. For example, for an interest rate
swap, changes in interest rates may increase the expected
exposure, which would increase the counterparty credit valuation
adjustment (CVA). Independently, counterparty credit spreads may
tighten, which would result in an offsetting decrease to CVA.
The Corporation early adopted, retrospective to January 1,
2015, the provision of new accounting guidance issued in January
2016 that requires the Corporation to record unrealized DVA
resulting from changes in the Corporation’s own credit spreads on
liabilities accounted for under the fair value option in accumulated
OCI. This new accounting guidance had no impact on the
accounting for DVA on derivatives. For additional information, see
New Accounting Pronouncements in Note 1 – Summary of
Significant Accounting Principles.
In 2014, the Corporation implemented a funding valuation
adjustment (FVA) into valuation estimates primarily to include
funding costs on uncollateralized derivatives and derivatives where
the Corporation is not permitted to use the collateral it receives.
The change in estimate resulted in a net pretax FVA charge of
$497 million, at the time of implementation, including a charge of
$632 million related to funding costs, partially offset by a funding
benefit of $135 million, both related to derivative asset exposures.
The net FVA charge was recorded as a reduction to sales and
trading revenue in Global Markets. The Corporation calculates this
valuation adjustment based on modeled expected exposure
profiles discounted for the funding risk premium inherent in these
derivatives. FVA related to derivative assets and liabilities is the
effect of funding costs on the fair value of these derivatives.
The Corporation enters into risk management activities to
offset market driven exposures. The Corporation often hedges the
counterparty spread risk in CVA with CDS. The Corporation hedges
other market risks in both CVA and DVA primarily with currency and
interest rate swaps. In certain instances, the net-of-hedge amounts
in the table below move in the same direction as the gross amount
or may move in the opposite direction. This is a consequence of
the complex interaction of the risks being hedged resulting in
limitations in the ability to perfectly hedge all of the market
exposures at all times.
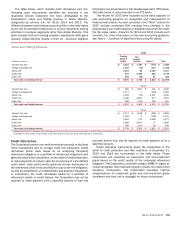
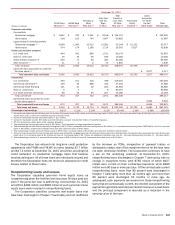
The table below presents CVA, DVA and FVA gains (losses) on
derivatives, which are recorded in trading account profits, on a
gross and net of hedge basis for 2015, 2014 and 2013. CVA gains
reduce the cumulative CVA thereby increasing the derivative assets
balance. DVA gains increase the cumulative DVA thereby
decreasing the derivative liabilities balance. CVA and DVA losses
have the opposite impact. FVA gains related to derivative assets
reduce the cumulative FVA thereby increasing the derivative assets
balance. FVA gains related to derivative liabilities increase the
cumulative FVA thereby decreasing the derivative liabilities
balance.
Valuation Adjustments on Derivatives
Gains (Losses)
2015 2014 2013
(Dollars in millions) Gross Net Gross Net Gross Net
Derivative assets (CVA) (1) $255 $227 $ (22) $ 191 $ 738 $ (96)
Derivative assets (FVA) (2) (34) (34) (632) (632) n/a n/a
Derivative liabilities (DVA) (3) (18) (153) (28) (150) (39) (75)
Derivative liabilities (FVA) (2) 50 50 135 135 n/a n/a
(1) At December 31, 2015, 2014 and 2013, the cumulative CVA reduced the derivative assets balance by $1.4 billion, $1.6 billion and $1.6 billion, respectively.
(2) FVA was adopted in 2014 and the cumulative FVA reduced the net derivatives balance by $481 million and $497 million at December 31, 2015 and 2014.
(3) At December 31, 2015, 2014 and 2013, the cumulative DVA reduced the derivative liabilities balance by $750 million, $769 million and $803 million, respectively.
n/a = not applicable