Bank of America 2015 Annual Report Download - page 55
Download and view the complete annual report
Please find page 55 of the 2015 Bank of America annual report below. You can navigate through the pages in the report by either clicking on the pages listed below, or by using the keyword search tool below to find specific information within the annual report.-
 1
1 -
2
-
3
-
4
-
5
-
6
-
7
-
8
-
9
-
10
-
11
-
12
-
13
-
14
-
15
-
16
-
17
-
18
-
19
-
20
-
21
-
22
-
23
-
24
-
25
-
26
-
27
-
28
-
29
-
30
-
31
-
32
-
33
-
34
-
35
-
36
-
37
-
38
-
39
-
40
-
41
-
42
-
43
-
44
-
 45
45 -
 46
46 -
 47
47 -
 48
48 -
 49
49 -
 50
50 -
 51
51 -
 52
52 -
 53
53 -
 54
54 -
 55
55 -
 56
56 -
 57
57 -
 58
58 -
 59
59 -
 60
60 -
 61
61 -
 62
62 -
 63
63 -
 64
64 -
 65
65 -
66
-
67
-
68
-
69
-
70
-
71
-
72
-
73
-
74
-
75
-
76
-
77
-
78
-
79
-
80
-
81
-
82
-
83
-
84
-
85
-
86
-
87
-
88
-
89
-
90
-
91
-
92
-
93
-
94
-
95
-
96
-
97
-
98
-
99
-
100
-
101
-
102
-
103
-
104
-
105
-
106
-
107
-
108
-
109
-
110
-
111
-
112
-
113
-
114
-
115
-
116
-
117
-
118
-
119
-
120
-
121
-
122
-
123
-
124
-
125
-
126
-
127
-
128
-
129
-
130
-
131
-
132
-
133
-
134
-
135
-
136
-
137
-
138
-
139
-
140
-
141
-
142
-
143
-
144
-
145
-
146
-
147
-
148
-
149
-
150
-
151
-
152
-
153
-
154
-
155
-
156
-
157
-
158
-
159
-
160
-
161
-
162
-
163
-
164
-
165
-
166
-
167
-
168
-
169
-
170
-
171
-
172
-
173
-
174
-
175
-
176
-
177
-
178
-
179
-
180
-
181
-
182
-
183
-
184
-
185
-
186
-
187
-
188
-
189
-
190
-
191
-
192
-
193
-
194
-
195
-
196
-
197
-
198
-
199
-
200
-
201
-
202
-
203
-
204
-
205
-
206
-
207
-
208
-
209
-
210
-
211
-
212
-
213
-
214
-
215
-
216
-
217
-
218
-
219
-
220
-
221
-
222
-
223
-
224
-
225
-
226
-
227
-
228
-
229
-
230
-
231
-
232
-
233
-
234
-
235
-
236
-
237
-
238
-
239
-
240
-
241
-
242
-
243
-
244
-
245
-
246
-
247
-
248
-
249
-
250
-
251
-
252
-
253
-
254
-
255
-
256
 |
 |
Bank of America 2015 53
December 31, 2015. Also effective January 1, 2015, Common
equity tier 1 capital is included in the measurement of “well-
capitalized” for depository institutions.
Beginning January 1, 2016, we are subject to a capital
conservation buffer, a countercyclical capital buffer and a global
systemically important bank (G-SIB) surcharge which will be
phased in over a three-year period ending January 1, 2019. Once
fully phased in, the Corporation’s risk-based capital ratio
requirements will include a capital conservation buffer greater than
2.5 percent, plus any applicable countercyclical capital buffer and
G-SIB surcharge in order to avoid certain restrictions on capital
distributions and discretionary bonus payments. The buffers and
surcharge must be composed solely of Common equity tier 1
capital. The countercyclical capital buffer is currently set at zero.
U.S. banking regulators must jointly decide on any increase in the
countercyclical buffer, after which time institutions will have up to
one year for implementation. Based on the Federal Reserve final
rule published in July 2015, we estimate that our G-SIB surcharge
will increase our risk-based capital ratio requirements by 3.0
percent once fully phased in. The G-SIB surcharge is calculated
annually and may differ from this estimate over time. For more
information on our G-SIB surcharge, see Capital Management –
Regulatory Developments on page 57.
Standardized Approach
Total risk-weighted assets under the Basel 3 Standardized
approach consist of credit risk and market risk measures. Credit
risk-weighted assets are measured by applying fixed risk weights
to on- and off-balance sheet exposures (excluding securitizations),
determined based on the characteristics of the exposure, such as
type of obligor, Organization for Economic Cooperation and
Development country risk code and maturity, among others. Off-
balance sheet exposures primarily include financial guarantees,
unfunded lending commitments, letters of credit and potential
future derivative exposures. Market risk applies to covered
positions which include trading assets and liabilities, foreign
exchange exposures and commodity exposures. Market risk
capital is modeled for general market risk and specific risk for
products where specific risk regulatory approval has been granted;
in the absence of specific risk model approval, standard specific
risk charges apply. For securitization exposures, risk-weighted
assets are determined using the Simplified Supervisory Formula
Approach (SSFA). Under the Standardized approach, no distinction
is made for variations in credit quality for corporate exposures,
and the economic benefit of collateral is restricted to a limited list
of eligible securities and cash.
Advanced Approaches
In addition to the credit risk and market risk measures, Basel 3
Advanced approaches include measures of operational risk and
risks related to the credit valuation adjustment (CVA) for over-the-
counter (OTC) derivative exposures. The Advanced approaches rely
on internal analytical models to measure risk weights for credit
risk exposures and allow the use of models to estimate the
exposure at default (EAD) for certain exposure types. Market risk
capital measurements are consistent with the Standardized
approach, except for securitization exposures. For both trading and
non-trading securitization exposures, institutions are permitted to
use the Supervisory Formula Approach (SFA) and would use the
SSFA if the SFA is unavailable for a particular exposure. Non-
securitization credit risk exposures are measured using internal
ratings-based models to determine the applicable risk weight by
estimating the probability of default, loss given default (LGD) and,
in certain instances, EAD. The internal analytical models primarily
rely on internal historical default and loss experience. Operational
risk is measured using internal analytical models which rely on
both internal and external operational loss experience and data.
The calculations require management to make estimates,
assumptions and interpretations, including with respect to the
probability of future events based on historical experience. Actual
results could differ from those estimates and assumptions. Under
the Federal Reserve’s reservation of authority, they may require us
to hold an amount of capital greater than otherwise required under
the capital rules if they determine that our risk-based capital
requirement using our internal analytical models is not
commensurate with our credit, market, operational or other risks.
Supplementary Leverage Ratio
Basel 3 also requires Advanced approaches institutions to
disclose a SLR. The numerator of the SLR is quarter-end Basel 3
Tier 1 capital reflective of Basel 3 numerator transition provisions.
The denominator is total leverage exposure based on the daily
average of the sum of on-balance sheet exposures less permitted
Tier 1 deductions, as well as the simple average of certain off-
balance sheet exposures, as of the end of each month in a quarter.
Off-balance sheet exposures primarily include undrawn lending
commitments, letters of credit, potential future derivative
exposures and repo-style transactions. Total leverage exposure
includes the effective notional principal amount of credit
derivatives and similar instruments through which credit protection
is sold. The credit conversion factors (CCFs) applied to certain off-
balance sheet exposures conform to the graduated CCF utilized
under the Basel 3 Standardized approach, but are subject to a
minimum 10 percent CCF. Effective January 1, 2018, the
Corporation will be required to maintain a minimum SLR of 3.0
percent, plus a supplementary leverage buffer of 2.0 percent, in
order to avoid certain restrictions on capital distributions and
discretionary bonuses. Insured depository institution subsidiaries
of BHCs, including BANA, will be required to maintain a minimum
6.0 percent SLR to be considered “well capitalized” under the PCA
framework.
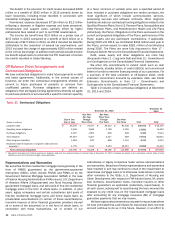
Capital Composition and Ratios
Table 13 presents Bank of America Corporation’s transition and
fully phased-in capital ratios and related information in accordance
with Basel 3 Standardized and Advanced approaches as measured
at December 31, 2015 and 2014. As of December 31, 2015 and
2014, the Corporation meets the definition of “well capitalized”
under current regulatory requirements.