Bank of America 2015 Annual Report Download - page 39
Download and view the complete annual report
Please find page 39 of the 2015 Bank of America annual report below. You can navigate through the pages in the report by either clicking on the pages listed below, or by using the keyword search tool below to find specific information within the annual report.-
 1
1 -
2
-
3
-
4
-
5
-
6
-
7
-
8
-
9
-
10
-
11
-
12
-
13
-
14
-
15
-
16
-
17
-
18
-
19
-
20
-
21
-
22
-
23
-
24
-
25
-
26
-
27
-
28
-
 29
29 -
 30
30 -
 31
31 -
 32
32 -
 33
33 -
 34
34 -
 35
35 -
 36
36 -
 37
37 -
 38
38 -
 39
39 -
 40
40 -
 41
41 -
 42
42 -
 43
43 -
 44
44 -
 45
45 -
 46
46 -
 47
47 -
 48
48 -
 49
49 -
50
-
51
-
52
-
53
-
54
-
55
-
56
-
57
-
58
-
59
-
60
-
61
-
62
-
63
-
64
-
65
-
66
-
67
-
68
-
69
-
70
-
71
-
72
-
73
-
74
-
75
-
76
-
77
-
78
-
79
-
80
-
81
-
82
-
83
-
84
-
85
-
86
-
87
-
88
-
89
-
90
-
91
-
92
-
93
-
94
-
95
-
96
-
97
-
98
-
99
-
100
-
101
-
102
-
103
-
104
-
105
-
106
-
107
-
108
-
109
-
110
-
111
-
112
-
113
-
114
-
115
-
116
-
117
-
118
-
119
-
120
-
121
-
122
-
123
-
124
-
125
-
126
-
127
-
128
-
129
-
130
-
131
-
132
-
133
-
134
-
135
-
136
-
137
-
138
-
139
-
140
-
141
-
142
-
143
-
144
-
145
-
146
-
147
-
148
-
149
-
150
-
151
-
152
-
153
-
154
-
155
-
156
-
157
-
158
-
159
-
160
-
161
-
162
-
163
-
164
-
165
-
166
-
167
-
168
-
169
-
170
-
171
-
172
-
173
-
174
-
175
-
176
-
177
-
178
-
179
-
180
-
181
-
182
-
183
-
184
-
185
-
186
-
187
-
188
-
189
-
190
-
191
-
192
-
193
-
194
-
195
-
196
-
197
-
198
-
199
-
200
-
201
-
202
-
203
-
204
-
205
-
206
-
207
-
208
-
209
-
210
-
211
-
212
-
213
-
214
-
215
-
216
-
217
-
218
-
219
-
220
-
221
-
222
-
223
-
224
-
225
-
226
-
227
-
228
-
229
-
230
-
231
-
232
-
233
-
234
-
235
-
236
-
237
-
238
-
239
-
240
-
241
-
242
-
243
-
244
-
245
-
246
-
247
-
248
-
249
-
250
-
251
-
252
-
253
-
254
-
255
-
256
 |
 |

Bank of America 2015 37
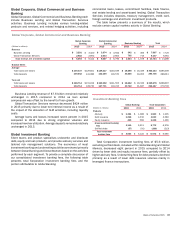
Global Corporate, Global Commercial and Business
Banking
Global Corporate, Global Commercial and Business Banking each
include Business Lending and Global Transaction Services
activities. Business Lending includes various lending-related
products and services, and related hedging activities, including
commercial loans, leases, commitment facilities, trade finance,
real estate lending and asset-based lending. Global Transaction
Services includes deposits, treasury management, credit card,
foreign exchange and short-term investment products.
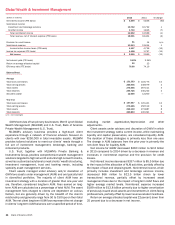
The table below presents a summary of the results, which
exclude certain capital markets activity in Global Banking.
Global Corporate, Global Commercial and Business Banking
Global Corporate
Banking
Global Commercial
Banking Business Banking Total
(Dollars in millions) 2015 2014 2015 2014 2015 2014 2015 2014
Revenue
Business Lending $ 3,291 $ 3,420 $ 3,974 $ 3,942 $342 $ 363 $ 7,607 $ 7,725
Global Transaction Services 2,802 2,992 2,633 2,854 702 715 6,137 6,561
Total revenue, net of interest expense $ 6,093 $ 6,412 $ 6,607 $ 6,796 $ 1,044 $ 1,078 $13,744 $ 14,286
Balance Sheet
Average
Total loans and leases $ 139,337 $129,601 $ 149,217 $140,539 $ 16,589 $ 16,329 $ 305,143 $286,469
Total deposits 139,042 141,386 122,149 116,570 33,545 30,055 294,736 288,011
Year end
Total loans and leases $ 148,714 $131,019 $ 160,302 $141,555 $ 16,662 $ 16,333 $ 325,678 $288,907
Total deposits 134,714 128,730 127,731 119,215 33,722 31,847 296,167 279,792
Business Lending revenue of $7.6 billion remained relatively
unchanged in 2015 compared to 2014 as loan spread
compression was offset by the benefit of loan growth.
Global Transaction Services revenue decreased $424 million
in 2015 primarily due to lower net interest income as a result of
the impact of the allocation of ALM activities, including liquidity
costs.
Average loans and leases increased seven percent in 2015
compared to 2014 due to strong origination volumes and
increased revolver utilization. Average deposits remained relatively
unchanged in 2015.
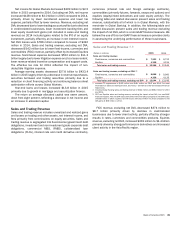
Global Investment Banking
Client teams and product specialists underwrite and distribute
debt, equity and loan products, and provide advisory services and
tailored risk management solutions. The economics of most
investment banking and underwriting activities are shared primarily
between Global Banking and Global Markets based on the activities
performed by each segment. To provide a complete discussion of
our consolidated investment banking fees, the following table
presents total Corporation investment banking fees and the
portion attributable to Global Banking.
Investment Banking Fees
Global Banking Total Corporation
(Dollars in millions) 2015 2014 2015 2014
Products
Advisory $ 1,354 $ 1,098 $ 1,503 $ 1,205
Debt issuance 1,296 1,532 3,033 3,583
Equity issuance 460 583 1,236 1,490
Gross investment banking
fees 3,110 3,213 5,772 6,278
Self-led deals (57) (91) (200) (213)
Total investment
banking fees $ 3,053 $ 3,122 $ 5,572 $ 6,065
Total Corporation investment banking fees of $5.6 billion,
excluding self-led deals, included within Global Banking and Global
Markets, decreased eight percent in 2015 compared to 2014
driven by lower debt and equity issuance fees, partially offset by
higher advisory fees. Underwriting fees for debt products declined
primarily as a result of lower debt issuance volumes mainly in
leveraged finance transactions.