Bank of America 2015 Annual Report Download - page 34
Download and view the complete annual report
Please find page 34 of the 2015 Bank of America annual report below. You can navigate through the pages in the report by either clicking on the pages listed below, or by using the keyword search tool below to find specific information within the annual report.-
 1
1 -
2
-
3
-
4
-
5
-
6
-
7
-
8
-
9
-
10
-
11
-
12
-
13
-
14
-
15
-
16
-
17
-
18
-
19
-
20
-
21
-
22
-
23
-
 24
24 -
 25
25 -
 26
26 -
 27
27 -
 28
28 -
 29
29 -
 30
30 -
 31
31 -
 32
32 -
 33
33 -
 34
34 -
 35
35 -
 36
36 -
 37
37 -
 38
38 -
 39
39 -
 40
40 -
 41
41 -
 42
42 -
 43
43 -
 44
44 -
45
-
46
-
47
-
48
-
49
-
50
-
51
-
52
-
53
-
54
-
55
-
56
-
57
-
58
-
59
-
60
-
61
-
62
-
63
-
64
-
65
-
66
-
67
-
68
-
69
-
70
-
71
-
72
-
73
-
74
-
75
-
76
-
77
-
78
-
79
-
80
-
81
-
82
-
83
-
84
-
85
-
86
-
87
-
88
-
89
-
90
-
91
-
92
-
93
-
94
-
95
-
96
-
97
-
98
-
99
-
100
-
101
-
102
-
103
-
104
-
105
-
106
-
107
-
108
-
109
-
110
-
111
-
112
-
113
-
114
-
115
-
116
-
117
-
118
-
119
-
120
-
121
-
122
-
123
-
124
-
125
-
126
-
127
-
128
-
129
-
130
-
131
-
132
-
133
-
134
-
135
-
136
-
137
-
138
-
139
-
140
-
141
-
142
-
143
-
144
-
145
-
146
-
147
-
148
-
149
-
150
-
151
-
152
-
153
-
154
-
155
-
156
-
157
-
158
-
159
-
160
-
161
-
162
-
163
-
164
-
165
-
166
-
167
-
168
-
169
-
170
-
171
-
172
-
173
-
174
-
175
-
176
-
177
-
178
-
179
-
180
-
181
-
182
-
183
-
184
-
185
-
186
-
187
-
188
-
189
-
190
-
191
-
192
-
193
-
194
-
195
-
196
-
197
-
198
-
199
-
200
-
201
-
202
-
203
-
204
-
205
-
206
-
207
-
208
-
209
-
210
-
211
-
212
-
213
-
214
-
215
-
216
-
217
-
218
-
219
-
220
-
221
-
222
-
223
-
224
-
225
-
226
-
227
-
228
-
229
-
230
-
231
-
232
-
233
-
234
-
235
-
236
-
237
-
238
-
239
-
240
-
241
-
242
-
243
-
244
-
245
-
246
-
247
-
248
-
249
-
250
-
251
-
252
-
253
-
254
-
255
-
256
 |
 |

32 Bank of America 2015
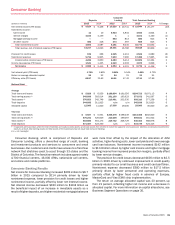
Deposits
Deposits includes the results of consumer deposit activities which
consist of a comprehensive range of products provided to
consumers and small businesses. Our deposit products include
traditional savings accounts, money market savings accounts, CDs
and IRAs, noninterest- and interest-bearing checking accounts, as
well as investment accounts and products. The revenue is
allocated to the deposit products using our funds transfer pricing
process that matches assets and liabilities with similar interest
rate sensitivity and maturity characteristics. Deposits generates
fees such as account service fees, non-sufficient funds fees,
overdraft charges and ATM fees, as well as investment and
brokerage fees from Merrill Edge accounts. Merrill Edge is an
integrated investing and banking service targeted at customers
with less than $250,000 in investable assets. Merrill Edge
provides investment advice and guidance, client brokerage asset
services, a self-directed online investing platform and key banking
capabilities including access to the Corporation’s network of
financial centers and ATMs.
Deposits includes the net impact of migrating customers and
their related deposit and brokerage asset balances between
Deposits and GWIM as well as other client-managed businesses.
For more information on the migration of customer balances to or
from GWIM, see GWIM on page 34.
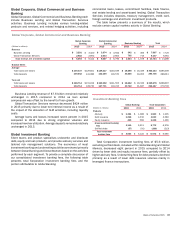
Net income for Deposits increased $270 million to $2.7 billion
in 2015 driven by higher net interest income, and lower noninterest
expense and provision for credit losses. Net interest income
increased $188 million to $9.6 billion primarily due to the
beneficial impact of an increase in investable assets as a result
of higher deposits, partially offset by the impact of the allocation
of ALM activities. Noninterest income of $4.6 billion remained
relatively unchanged.
The provision for credit losses decreased $69 million to $199
million driven by continued improvement in credit quality.
Noninterest expense decreased $113 million to $9.8 billion due
to lower operating expenses.
Average deposits increased $32.8 billion to $544.7 billion in
2015 driven by a continuing customer shift to more liquid products
in the low rate environment. Growth in checking, traditional savings
and money market savings of $43.5 billion was partially offset by
a decline in time deposits of $10.7 billion. As a result of our
continued pricing discipline and the shift in the mix of deposits,
the rate paid on average deposits declined by one bp to five bps.
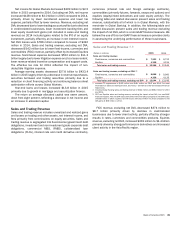
Key Statistics – Deposits
2015 2014
Total deposit spreads (excludes noninterest costs) 1.63% 1.60%
Year end
Client brokerage assets (in millions) $ 122,721 $ 113,763
Online banking active accounts (units in thousands) 31,674 30,904
Mobile banking active users (units in thousands) 18,705 16,539
Financial centers 4,726 4,855
ATMs 16,038 15,834
Client brokerage assets increased $9.0 billion in 2015 driven
by strong account flows, partially offset by lower market valuations.
Mobile banking active users increased 2.2 million reflecting
continuing changes in our customers’ banking preferences. The
number of financial centers declined 129 driven by changes in
customer preferences to self-service options and as we continue
to optimize our consumer banking network and improve our cost-
to-serve.
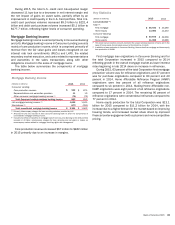
Consumer Lending
Consumer Lending offers products to consumers and small
businesses across the U.S. The products offered include credit
and debit cards, residential mortgages and home equity loans,
and direct and indirect loans such as automotive, marine, aircraft,
recreational vehicle and consumer personal loans. In addition to
earning net interest spread revenue on its lending activities,
Consumer Lending generates interchange revenue from credit and
debit card transactions, late fees, cash advance fees, annual credit
card fees, mortgage banking fee income and other miscellaneous
fees. Consumer Lending products are available to our customers
through our retail network, direct telephone, and online and mobile
channels.
Consumer Lending includes the net impact of migrating
customers and their related loan balances between Consumer
Lending and GWIM. For more information on the migration of
customer balances to or from GWIM, see GWIM on page 34.
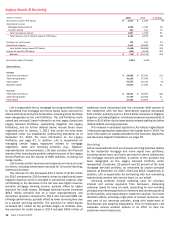
Net income for Consumer Lending remained relatively
unchanged at $4.1 billion in 2015 as lower noninterest expense,
higher noninterest income and lower provision for credit losses
largely offset the decline in net interest income. Net interest
income decreased $521 million to $10.2 billion driven by higher
funding costs, lower card yields and average card loan balances,
and the impact of the allocation of ALM activities, partially offset
by higher residential mortgage balances. Noninterest income
increased $136 million to $6.2 billion due to higher card income
as well as mortgage banking income from improved production
margins.
The provision for credit losses decreased $87 million to $2.3
billion in 2015 driven by continued credit quality improvement
within the small business and credit card portfolios. Noninterest
expense decreased $267 million to $7.7 billion primarily driven
by lower personnel expense, partially offset by higher fraud costs
in advance of EMV chip implementation.
Average loans increased $7.8 billion to $198.9 billion in 2015
primarily driven by increases in residential mortgages and
consumer vehicle loans, partially offset by lower home equity loans
and continued run-off of non-core portfolios. Beginning with new
originations in 2014, we retain certain residential mortgages in
Consumer Banking, consistent with where the overall relationship
is managed; previously such mortgages were in All Other.
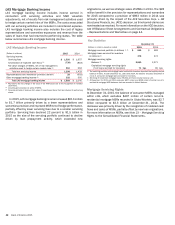
Key Statistics – Consumer Lending
(Dollars in millions) 2015 2014
Total U.S. credit card (1)
Gross interest yield 9.16% 9.34%
Risk-adjusted margin 9.33 9.44
New accounts (in thousands) 4,973 4,541
Purchase volumes $ 221,378 $212,088
Debit card purchase volumes $ 277,695 $272,576
(1) In addition to the U.S. credit card portfolio in Consumer Banking, the remaining U.S. credit card
portfolio is in GWIM.