Bank of America 2015 Annual Report Download - page 85
Download and view the complete annual report
Please find page 85 of the 2015 Bank of America annual report below. You can navigate through the pages in the report by either clicking on the pages listed below, or by using the keyword search tool below to find specific information within the annual report.-
 1
1 -
2
-
3
-
4
-
5
-
6
-
7
-
8
-
9
-
10
-
11
-
12
-
13
-
14
-
15
-
16
-
17
-
18
-
19
-
20
-
21
-
22
-
23
-
24
-
25
-
26
-
27
-
28
-
29
-
30
-
31
-
32
-
33
-
34
-
35
-
36
-
37
-
38
-
39
-
40
-
41
-
42
-
43
-
44
-
45
-
46
-
47
-
48
-
49
-
50
-
51
-
52
-
53
-
54
-
55
-
56
-
57
-
58
-
59
-
60
-
61
-
62
-
63
-
64
-
65
-
66
-
67
-
68
-
69
-
70
-
71
-
72
-
73
-
74
-
 75
75 -
 76
76 -
 77
77 -
 78
78 -
 79
79 -
 80
80 -
 81
81 -
 82
82 -
 83
83 -
 84
84 -
 85
85 -
 86
86 -
 87
87 -
 88
88 -
 89
89 -
 90
90 -
 91
91 -
 92
92 -
 93
93 -
 94
94 -
 95
95 -
96
-
97
-
98
-
99
-
100
-
101
-
102
-
103
-
104
-
105
-
106
-
107
-
108
-
109
-
110
-
111
-
112
-
113
-
114
-
115
-
116
-
117
-
118
-
119
-
120
-
121
-
122
-
123
-
124
-
125
-
126
-
127
-
128
-
129
-
130
-
131
-
132
-
133
-
134
-
135
-
136
-
137
-
138
-
139
-
140
-
141
-
142
-
143
-
144
-
145
-
146
-
147
-
148
-
149
-
150
-
151
-
152
-
153
-
154
-
155
-
156
-
157
-
158
-
159
-
160
-
161
-
162
-
163
-
164
-
165
-
166
-
167
-
168
-
169
-
170
-
171
-
172
-
173
-
174
-
175
-
176
-
177
-
178
-
179
-
180
-
181
-
182
-
183
-
184
-
185
-
186
-
187
-
188
-
189
-
190
-
191
-
192
-
193
-
194
-
195
-
196
-
197
-
198
-
199
-
200
-
201
-
202
-
203
-
204
-
205
-
206
-
207
-
208
-
209
-
210
-
211
-
212
-
213
-
214
-
215
-
216
-
217
-
218
-
219
-
220
-
221
-
222
-
223
-
224
-
225
-
226
-
227
-
228
-
229
-
230
-
231
-
232
-
233
-
234
-
235
-
236
-
237
-
238
-
239
-
240
-
241
-
242
-
243
-
244
-
245
-
246
-
247
-
248
-
249
-
250
-
251
-
252
-
253
-
254
-
255
-
256
 |
 |

Bank of America 2015 83
Table 48 Net Credit Default Protection by Credit
Exposure Debt Rating
December 31
2015 2014
(Dollars in millions)
Net
Notional (1)
Percent of
Total
Net
Notional (1)
Percent of
Total
Ratings (2, 3)
AA $ — —% $ (30) 0.4%
A(752) 11.3 (660) 9.0
BBB (3,030) 45.4 (4,401) 60.3
BB (2,090) 31.3 (1,527) 20.9
B(634) 9.5 (610) 8.4
CCC and below (139) 2.1 (42) 0.6
NR (4) (32) 0.4 (32) 0.4
Total net credit
default protection $ (6,677) 100.0% $ (7,302) 100.0%
(1) Represents net credit default protection (purchased) sold.
(2) Ratings are refreshed on a quarterly basis.
(3) Ratings of BBB- or higher are considered to meet the definition of investment grade.
(4) NR is comprised of index positions held and any names that have not been rated.
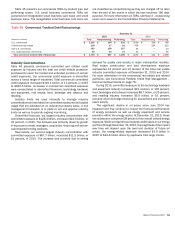
In addition to our net notional credit default protection
purchased to cover the funded and unfunded portion of certain
credit exposures, credit derivatives are used for market-making
activities for clients and establishing positions intended to profit
from directional or relative value changes. We execute the majority
of our credit derivative trades in the OTC market with large,
multinational financial institutions, including broker-dealers and,
to a lesser degree, with a variety of other investors. Because these
transactions are executed in the OTC market, we are subject to
settlement risk. We are also subject to credit risk in the event that
these counterparties fail to perform under the terms of these
contracts. In most cases, credit derivative transactions are
executed on a daily margin basis. Therefore, events such as a
credit downgrade, depending on the ultimate rating level, or a
breach of credit covenants would typically require an increase in
the amount of collateral required by the counterparty, where
applicable, and/or allow us to take additional protective measures
such as early termination of all trades.
Table 49 presents the total contract/notional amount of credit
derivatives outstanding and includes both purchased and written
credit derivatives. The credit risk amounts are measured as net
asset exposure by counterparty, taking into consideration all
contracts with the counterparty. For more information on our written
credit derivatives, see Note 2 – Derivatives to the Consolidated
Financial Statements.
The credit risk amounts discussed above and presented in
Table 49 take into consideration the effects of legally enforceable
master netting agreements while amounts disclosed in Note 2 –
Derivatives to the Consolidated Financial Statements are shown
on a gross basis. Credit risk reflects the potential benefit from
offsetting exposure to non-credit derivative products with the same
counterparties that may be netted upon the occurrence of certain
events, thereby reducing our overall exposure.
Table 49 Credit Derivatives
December 31
2015 2014
(Dollars in millions)
Contract/
Notional Credit Risk
Contract/
Notional Credit Risk
Purchased credit derivatives:
Credit default swaps $ 928,300 $ 3,677 $ 1,094,796 $ 3,833
Total return swaps/other 26,427 1,596 44,333 510
Total purchased credit derivatives $ 954,727 $ 5,273 $ 1,139,129 $ 4,343
Written credit derivatives:
Credit default swaps $ 924,143 n/a $ 1,073,101 n/a
Total return swaps/other 39,658 n/a 61,031 n/a
Total written credit derivatives $ 963,801 n/a $ 1,134,132 n/a
n/a = not applicable
Counterparty Credit Risk Valuation Adjustments
We record counterparty credit risk valuation adjustments on
certain derivative assets, including our credit default protection
purchased, in order to properly reflect the credit risk of the
counterparty, as presented in Table 50. We calculate CVA based
on a modeled expected exposure that incorporates current market
risk factors including changes in market spreads and non-credit
related market factors that affect the value of a derivative. The
exposure also takes into consideration credit mitigants such as
legally enforceable master netting agreements and collateral. For
additional information, see Note 2 – Derivatives to the Consolidated
Financial Statements.
We enter into risk management activities to offset market
driven exposures. We often hedge the counterparty spread risk in
CVA with credit default swaps (CDS). We hedge other market risks
in CVA primarily with currency and interest rate swaps. In certain
instances, the net-of-hedge amounts in the table below move in
the same direction as the gross amount or may move in the
opposite direction. This is a consequence of the complex
interaction of the risks being hedged resulting in limitations in the
ability to perfectly hedge all of the market exposures at all times.
Table 50 Credit Valuation Gains and Losses
Gains (Losses) 2015 2014
(Dollars in millions) Gross Hedge Net Gross Hedge Net
Credit valuation $ 255 $ (28) $ 227 $ (22) $ 213 $ 191