Bank of America 2015 Annual Report Download - page 38
Download and view the complete annual report
Please find page 38 of the 2015 Bank of America annual report below. You can navigate through the pages in the report by either clicking on the pages listed below, or by using the keyword search tool below to find specific information within the annual report.-
 1
1 -
2
-
3
-
4
-
5
-
6
-
7
-
8
-
9
-
10
-
11
-
12
-
13
-
14
-
15
-
16
-
17
-
18
-
19
-
20
-
21
-
22
-
23
-
24
-
25
-
26
-
27
-
 28
28 -
 29
29 -
 30
30 -
 31
31 -
 32
32 -
 33
33 -
 34
34 -
 35
35 -
 36
36 -
 37
37 -
 38
38 -
 39
39 -
 40
40 -
 41
41 -
 42
42 -
 43
43 -
 44
44 -
 45
45 -
 46
46 -
 47
47 -
 48
48 -
49
-
50
-
51
-
52
-
53
-
54
-
55
-
56
-
57
-
58
-
59
-
60
-
61
-
62
-
63
-
64
-
65
-
66
-
67
-
68
-
69
-
70
-
71
-
72
-
73
-
74
-
75
-
76
-
77
-
78
-
79
-
80
-
81
-
82
-
83
-
84
-
85
-
86
-
87
-
88
-
89
-
90
-
91
-
92
-
93
-
94
-
95
-
96
-
97
-
98
-
99
-
100
-
101
-
102
-
103
-
104
-
105
-
106
-
107
-
108
-
109
-
110
-
111
-
112
-
113
-
114
-
115
-
116
-
117
-
118
-
119
-
120
-
121
-
122
-
123
-
124
-
125
-
126
-
127
-
128
-
129
-
130
-
131
-
132
-
133
-
134
-
135
-
136
-
137
-
138
-
139
-
140
-
141
-
142
-
143
-
144
-
145
-
146
-
147
-
148
-
149
-
150
-
151
-
152
-
153
-
154
-
155
-
156
-
157
-
158
-
159
-
160
-
161
-
162
-
163
-
164
-
165
-
166
-
167
-
168
-
169
-
170
-
171
-
172
-
173
-
174
-
175
-
176
-
177
-
178
-
179
-
180
-
181
-
182
-
183
-
184
-
185
-
186
-
187
-
188
-
189
-
190
-
191
-
192
-
193
-
194
-
195
-
196
-
197
-
198
-
199
-
200
-
201
-
202
-
203
-
204
-
205
-
206
-
207
-
208
-
209
-
210
-
211
-
212
-
213
-
214
-
215
-
216
-
217
-
218
-
219
-
220
-
221
-
222
-
223
-
224
-
225
-
226
-
227
-
228
-
229
-
230
-
231
-
232
-
233
-
234
-
235
-
236
-
237
-
238
-
239
-
240
-
241
-
242
-
243
-
244
-
245
-
246
-
247
-
248
-
249
-
250
-
251
-
252
-
253
-
254
-
255
-
256
 |
 |

36 Bank of America 2015
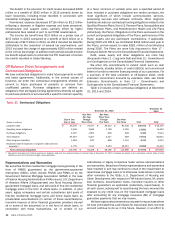
Global Banking
(Dollars in millions) 2015 2014 % Change
Net interest income (FTE basis) $ 9,254 $ 9,810 (6)%
Noninterest income:
Service charges 2,914 2,901 —
Investment banking fees 3,110 3,213 (3)
All other income 1,641 1,683 (2)
Total noninterest income 7,665 7,797 (2)
Total revenue, net of interest expense (FTE basis) 16,919 17,607 (4)
Provision for credit losses 685 322 113
Noninterest expense 7,888 8,170 (3)
Income before income taxes (FTE basis) 8,346 9,115 (8)
Income tax expense (FTE basis) 3,073 3,346 (8)
Net income $ 5,273 $ 5,769 (9)
Net interest yield (FTE basis) 2.85%3.10%
Return on average allocated capital 15 17
Efficiency ratio (FTE basis) 46.62 46.40
Balance Sheet
Average
Total loans and leases $ 305,220 $ 286,484 7
Total earning assets 324,402 316,880 2
Total assets 369,001 362,273 2
Total deposits 294,733 288,010 2
Allocated capital 35,000 33,500 4
Year end
Total loans and leases $ 325,677 $ 288,905 13
Total earning assets 336,755 308,419 9
Total assets 382,043 353,637 8
Total deposits 296,162 279,792 6
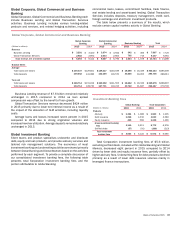
Global Banking, which includes Global Corporate Banking,
Global Commercial Banking, Business Banking and Global
Investment Banking, provides a wide range of lending-related
products and services, integrated working capital management
and treasury solutions to clients, and underwriting and advisory
services through our network of offices and client relationship
teams. Our lending products and services include commercial
loans, leases, commitment facilities, trade finance, real estate
lending and asset-based lending. Our treasury solutions business
includes treasury management, foreign exchange and short-term
investing options. We also provide investment banking products
to our clients such as debt and equity underwriting and distribution,
and merger-related and other advisory services. Underwriting debt
and equity issuances, fixed-income and equity research, and
certain market-based activities are executed through our global
broker-dealer affiliates which are our primary dealers in several
countries. Within Global Banking, Global Commercial Banking
clients generally include middle-market companies, commercial
real estate firms, auto dealerships and not-for-profit companies.
Global Corporate Banking clients generally include large global
corporations, financial institutions and leasing clients. Business
Banking clients include mid-sized U.S.-based businesses requiring
customized and integrated financial advice and solutions.
Net income for Global Banking decreased $496 million to $5.3
billion in 2015 compared to 2014 primarily driven by lower revenue
and higher provision for credit losses, partially offset by lower
noninterest expense.
Revenue decreased $688 million to $16.9 billion in 2015
primarily due to lower net interest income. The decline in net
interest income reflects the impact of the allocation of ALM
activities, including liquidity costs as well as loan spread
compression, partially offset by loan growth. Noninterest income
of $7.7 billion remained relatively unchanged in 2015.
The provision for credit losses increased $363 million to $685
million in 2015 primarily driven by energy exposure and loan
growth. For additional information, see Commercial Portfolio Credit
Risk Management – Industry Concentrations on page 81.
Noninterest expense decreased $282 million to $7.9 billion in
2015 primarily due to lower litigation expense and technology
initiative costs.
The return on average allocated capital was 15 percent in 2015,
down from 17 percent in 2014, due to increased capital allocations
and lower net income. For more information on capital allocated
to the business segments, see Business Segment Operations on
page 30.