Bank of America 2015 Annual Report Download - page 78
Download and view the complete annual report
Please find page 78 of the 2015 Bank of America annual report below. You can navigate through the pages in the report by either clicking on the pages listed below, or by using the keyword search tool below to find specific information within the annual report.-
 1
1 -
2
-
3
-
4
-
5
-
6
-
7
-
8
-
9
-
10
-
11
-
12
-
13
-
14
-
15
-
16
-
17
-
18
-
19
-
20
-
21
-
22
-
23
-
24
-
25
-
26
-
27
-
28
-
29
-
30
-
31
-
32
-
33
-
34
-
35
-
36
-
37
-
38
-
39
-
40
-
41
-
42
-
43
-
44
-
45
-
46
-
47
-
48
-
49
-
50
-
51
-
52
-
53
-
54
-
55
-
56
-
57
-
58
-
59
-
60
-
61
-
62
-
63
-
64
-
65
-
66
-
67
-
 68
68 -
 69
69 -
 70
70 -
 71
71 -
 72
72 -
 73
73 -
 74
74 -
 75
75 -
 76
76 -
 77
77 -
 78
78 -
 79
79 -
 80
80 -
 81
81 -
 82
82 -
 83
83 -
 84
84 -
 85
85 -
 86
86 -
 87
87 -
 88
88 -
89
-
90
-
91
-
92
-
93
-
94
-
95
-
96
-
97
-
98
-
99
-
100
-
101
-
102
-
103
-
104
-
105
-
106
-
107
-
108
-
109
-
110
-
111
-
112
-
113
-
114
-
115
-
116
-
117
-
118
-
119
-
120
-
121
-
122
-
123
-
124
-
125
-
126
-
127
-
128
-
129
-
130
-
131
-
132
-
133
-
134
-
135
-
136
-
137
-
138
-
139
-
140
-
141
-
142
-
143
-
144
-
145
-
146
-
147
-
148
-
149
-
150
-
151
-
152
-
153
-
154
-
155
-
156
-
157
-
158
-
159
-
160
-
161
-
162
-
163
-
164
-
165
-
166
-
167
-
168
-
169
-
170
-
171
-
172
-
173
-
174
-
175
-
176
-
177
-
178
-
179
-
180
-
181
-
182
-
183
-
184
-
185
-
186
-
187
-
188
-
189
-
190
-
191
-
192
-
193
-
194
-
195
-
196
-
197
-
198
-
199
-
200
-
201
-
202
-
203
-
204
-
205
-
206
-
207
-
208
-
209
-
210
-
211
-
212
-
213
-
214
-
215
-
216
-
217
-
218
-
219
-
220
-
221
-
222
-
223
-
224
-
225
-
226
-
227
-
228
-
229
-
230
-
231
-
232
-
233
-
234
-
235
-
236
-
237
-
238
-
239
-
240
-
241
-
242
-
243
-
244
-
245
-
246
-
247
-
248
-
249
-
250
-
251
-
252
-
253
-
254
-
255
-
256
 |
 |

76 Bank of America 2015
They are carried at fair value with changes in fair value recorded
in other income (loss).
In addition, the Corporation is a member of various securities
and derivative exchanges and clearinghouses, both in the U.S. and
other countries. As a member, the Corporation may be required to
pay a pro-rata share of the losses incurred by some of these
organizations as a result of another member default and under
other loss scenarios. For additional information, see Note 12 –
Commitments and Contingencies to the Consolidated Financial
Statements.
Commercial Credit Portfolio
During 2015, credit quality among large corporate borrowers
remained stable except in the energy sector which experienced
some deterioration due to the sustained drop in oil prices. Credit
quality of commercial real estate borrowers continued to improve
as property valuations increased and vacancy rates remained low.
Outstanding commercial loans and leases increased $54.0
billion, primarily in U.S. commercial, non-U.S. commercial and
commercial real estate. Nonperforming commercial loans and
leases increased $112 million during 2015. Nonperforming
commercial loans and leases as a percentage of outstanding loans
and leases, excluding loans accounted for under the fair value
option, decreased during 2015 to 0.27 percent from 0.29 percent
at December 31, 2014. Reservable criticized balances increased
$4.9 billion to $16.5 billion during 2015 as a result of downgrades
outpacing paydowns and upgrades. The increase in reservable
criticized balances was primarily due to our energy exposure as
the credit quality of certain borrowers was impacted by the
sustained drop in oil prices. The allowance for loan and lease
losses for the commercial portfolio increased $412 million to $4.8
billion at December 31, 2015 compared to December 31, 2014.
For additional information, see Allowance for Credit Losses on
page 86.
Table 37 presents our commercial loans and leases portfolio,
and related credit quality information at December 31, 2015 and
2014.
Table 37 Commercial Loans and Leases
December 31
Outstandings Nonperforming
Accruing Past Due
90 Days or More
(Dollars in millions) 2015 2014 2015 2014 2015 2014
U.S. commercial $ 252,771 $220,293 $867 $ 701 $113 $ 110
Commercial real estate (1) 57,199 47,682 93 321 33
Commercial lease financing 27,370 24,866 12 317 41
Non-U.S. commercial 91,549 80,083 158 11—
428,889 372,924 1,130 1,026 134 154
U.S. small business commercial (2) 12,876 13,293 82 87 61 67
Commercial loans excluding loans accounted for under the fair value option 441,765 386,217 1,212 1,113 195 221
Loans accounted for under the fair value option (3) 5,067 6,604 13 ———
Total commercial loans and leases $ 446,832 $392,821 $ 1,225 $ 1,113 $195 $ 221
(1) Includes U.S. commercial real estate loans of $53.6 billion and $45.2 billion and non-U.S. commercial real estate loans of $3.5 billion and $2.5 billion at December 31, 2015 and 2014.
(2) Includes card-related products.
(3) Commercial loans accounted for under the fair value option include U.S. commercial loans of $2.3 billion and $1.9 billion and non-U.S. commercial loans of $2.8 billion and $4.7 billion at December
31, 2015 and 2014. For more information on the fair value option, see Note 21 – Fair Value Option to the Consolidated Financial Statements.
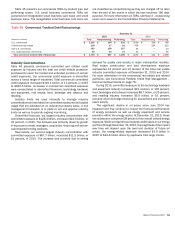
Table 38 presents net charge-offs and related ratios for our commercial loans and leases for 2015 and 2014. The increase in net
charge-offs of $110 million in 2015 was primarily related to higher recoveries in commercial real estate in 2014 and higher energy
sector related losses in 2015.
Table 38 Commercial Net Charge-offs and Related Ratios
Net Charge-offs Net Charge-off Ratios (1)
(Dollars in millions) 2015 2014 2015 2014
U.S. commercial $139 $ 88 0.06%0.04%
Commercial real estate (5) (83) (0.01) (0.18)
Commercial lease financing 9(9)0.04 (0.04)
Non-U.S. commercial 54 34 0.06 0.04
197 30 0.05 0.01
U.S. small business commercial 225 282 1.71 2.10
Total commercial $ 422 $ 312 0.10 0.08
(1) Net charge-off ratios are calculated as net charge-offs divided by average outstanding loans and leases excluding loans accounted for under the fair value option.