Bank of America 2015 Annual Report Download - page 82
Download and view the complete annual report
Please find page 82 of the 2015 Bank of America annual report below. You can navigate through the pages in the report by either clicking on the pages listed below, or by using the keyword search tool below to find specific information within the annual report.-
 1
1 -
2
-
3
-
4
-
5
-
6
-
7
-
8
-
9
-
10
-
11
-
12
-
13
-
14
-
15
-
16
-
17
-
18
-
19
-
20
-
21
-
22
-
23
-
24
-
25
-
26
-
27
-
28
-
29
-
30
-
31
-
32
-
33
-
34
-
35
-
36
-
37
-
38
-
39
-
40
-
41
-
42
-
43
-
44
-
45
-
46
-
47
-
48
-
49
-
50
-
51
-
52
-
53
-
54
-
55
-
56
-
57
-
58
-
59
-
60
-
61
-
62
-
63
-
64
-
65
-
66
-
67
-
68
-
69
-
70
-
71
-
 72
72 -
 73
73 -
 74
74 -
 75
75 -
 76
76 -
 77
77 -
 78
78 -
 79
79 -
 80
80 -
 81
81 -
 82
82 -
 83
83 -
 84
84 -
 85
85 -
 86
86 -
 87
87 -
 88
88 -
 89
89 -
 90
90 -
 91
91 -
 92
92 -
93
-
94
-
95
-
96
-
97
-
98
-
99
-
100
-
101
-
102
-
103
-
104
-
105
-
106
-
107
-
108
-
109
-
110
-
111
-
112
-
113
-
114
-
115
-
116
-
117
-
118
-
119
-
120
-
121
-
122
-
123
-
124
-
125
-
126
-
127
-
128
-
129
-
130
-
131
-
132
-
133
-
134
-
135
-
136
-
137
-
138
-
139
-
140
-
141
-
142
-
143
-
144
-
145
-
146
-
147
-
148
-
149
-
150
-
151
-
152
-
153
-
154
-
155
-
156
-
157
-
158
-
159
-
160
-
161
-
162
-
163
-
164
-
165
-
166
-
167
-
168
-
169
-
170
-
171
-
172
-
173
-
174
-
175
-
176
-
177
-
178
-
179
-
180
-
181
-
182
-
183
-
184
-
185
-
186
-
187
-
188
-
189
-
190
-
191
-
192
-
193
-
194
-
195
-
196
-
197
-
198
-
199
-
200
-
201
-
202
-
203
-
204
-
205
-
206
-
207
-
208
-
209
-
210
-
211
-
212
-
213
-
214
-
215
-
216
-
217
-
218
-
219
-
220
-
221
-
222
-
223
-
224
-
225
-
226
-
227
-
228
-
229
-
230
-
231
-
232
-
233
-
234
-
235
-
236
-
237
-
238
-
239
-
240
-
241
-
242
-
243
-
244
-
245
-
246
-
247
-
248
-
249
-
250
-
251
-
252
-
253
-
254
-
255
-
256
 |
 |

80 Bank of America 2015
phase, interest income is typically paid from interest reserves that
are established at the inception of the loan. As construction is
completed and the property is put into service, these interest
reserves are depleted and interest payments from operating cash
flows begin. We do not recognize interest income on nonperforming
loans regardless of the existence of an interest reserve.
Non-U.S. Commercial
At December 31, 2015, 74 percent of the non-U.S. commercial
loan portfolio was managed in Global Banking and 26 percent in
Global Markets. Outstanding loans, excluding loans accounted for
under the fair value option, increased $11.5 billion in 2015
primarily due to growth in securitization finance on consumer loans
and increased corporate demand. Net charge-offs increased $20
million to $54 million in 2015. For more information on the non-
U.S. commercial portfolio, see Non-U.S. Portfolio on page 84.
U.S. Small Business Commercial
The U.S. small business commercial loan portfolio is comprised
of small business card loans and small business loans managed
in Consumer Banking. Credit card-related products were 45 percent
and 43 percent of the U.S. small business commercial portfolio
at December 31, 2015 and 2014. Net charge-offs decreased $57
million to $225 million in 2015 primarily driven by improvement
in small business card loan delinquencies, a reduction in higher
risk vintages and increased recoveries from the sale of previously
charged-off loans. Of the U.S. small business commercial net
charge-offs, 81 percent and 73 percent were credit card-related
products in 2015 and 2014.
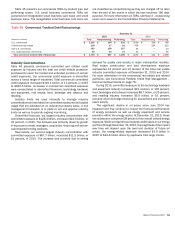
Nonperforming Commercial Loans, Leases and
Foreclosed Properties Activity
Table 44 presents the nonperforming commercial loans, leases
and foreclosed properties activity during 2015 and 2014.
Nonperforming loans do not include loans accounted for under the
fair value option. During 2015, nonperforming commercial loans
and leases increased $99 million to $1.2 billion primarily due to
energy sector related exposure. The decline in foreclosed
properties of $52 million in 2015 was primarily due to the sale of
properties. Approximately 88 percent of commercial
nonperforming loans, leases and foreclosed properties were
secured and approximately 69 percent were contractually current.
Commercial nonperforming loans were carried at approximately
85 percent of their unpaid principal balance before consideration
of the allowance for loan and lease losses as the carrying value
of these loans has been reduced to the estimated property value
less costs to sell.
Table 44 Nonperforming Commercial Loans, Leases and Foreclosed Properties Activity (1, 2)
(Dollars in millions) 2015 2014
Nonperforming loans and leases, January 1 $ 1,113 $1,309
Additions to nonperforming loans and leases:
New nonperforming loans and leases 1,367 1,228
Advances 36 48
Reductions to nonperforming loans and leases:
Paydowns (491)(717)
Sales (108)(149)
Returns to performing status (3) (130)(261)
Charge-offs (362)(332)
Transfers to foreclosed properties (4) (213)(13)
Total net additions (reductions) to nonperforming loans and leases 99 (196)
Total nonperforming loans and leases, December 31 1,212 1,113
Foreclosed properties, January 1 67 90
Additions to foreclosed properties:
New foreclosed properties (4) 207 11
Reductions to foreclosed properties:
Sales (256)(26)
Write-downs (3)(8)
Total net reductions to foreclosed properties (52) (23)
Total foreclosed properties, December 31 15 67
Nonperforming commercial loans, leases and foreclosed properties, December 31 $ 1,227 $1,180
Nonperforming commercial loans and leases as a percentage of outstanding commercial loans and leases (5) 0.27%0.29%
Nonperforming commercial loans, leases and foreclosed properties as a percentage of outstanding commercial loans, leases and foreclosed
properties (5) 0.28 0.31
(1) Balances do not include nonperforming LHFS of $220 million and $212 million at December 31, 2015 and 2014.
(2) Includes U.S. small business commercial activity. Small business card loans are excluded as they are not classified as nonperforming.
(3) Commercial loans and leases may be returned to performing status when all principal and interest is current and full repayment of the remaining contractual principal and interest is expected, or
when the loan otherwise becomes well-secured and is in the process of collection. TDRs are generally classified as performing after a sustained period of demonstrated payment performance.
(4) New foreclosed properties represents transfers of nonperforming loans to foreclosed properties net of charge-offs recorded during the first 90 days after transfer of a loan to foreclosed properties.
(5) Outstanding commercial loans exclude loans accounted for under the fair value option.