Bank of America 2015 Annual Report Download - page 242
Download and view the complete annual report
Please find page 242 of the 2015 Bank of America annual report below. You can navigate through the pages in the report by either clicking on the pages listed below, or by using the keyword search tool below to find specific information within the annual report.-
 1
1 -
2
-
3
-
4
-
5
-
6
-
7
-
8
-
9
-
10
-
11
-
12
-
13
-
14
-
15
-
16
-
17
-
18
-
19
-
20
-
21
-
22
-
23
-
24
-
25
-
26
-
27
-
28
-
29
-
30
-
31
-
32
-
33
-
34
-
35
-
36
-
37
-
38
-
39
-
40
-
41
-
42
-
43
-
44
-
45
-
46
-
47
-
48
-
49
-
50
-
51
-
52
-
53
-
54
-
55
-
56
-
57
-
58
-
59
-
60
-
61
-
62
-
63
-
64
-
65
-
66
-
67
-
68
-
69
-
70
-
71
-
72
-
73
-
74
-
75
-
76
-
77
-
78
-
79
-
80
-
81
-
82
-
83
-
84
-
85
-
86
-
87
-
88
-
89
-
90
-
91
-
92
-
93
-
94
-
95
-
96
-
97
-
98
-
99
-
100
-
101
-
102
-
103
-
104
-
105
-
106
-
107
-
108
-
109
-
110
-
111
-
112
-
113
-
114
-
115
-
116
-
117
-
118
-
119
-
120
-
121
-
122
-
123
-
124
-
125
-
126
-
127
-
128
-
129
-
130
-
131
-
132
-
133
-
134
-
135
-
136
-
137
-
138
-
139
-
140
-
141
-
142
-
143
-
144
-
145
-
146
-
147
-
148
-
149
-
150
-
151
-
152
-
153
-
154
-
155
-
156
-
157
-
158
-
159
-
160
-
161
-
162
-
163
-
164
-
165
-
166
-
167
-
168
-
169
-
170
-
171
-
172
-
173
-
174
-
175
-
176
-
177
-
178
-
179
-
180
-
181
-
182
-
183
-
184
-
185
-
186
-
187
-
188
-
189
-
190
-
191
-
192
-
193
-
194
-
195
-
196
-
197
-
198
-
199
-
200
-
201
-
202
-
203
-
204
-
205
-
206
-
207
-
208
-
209
-
210
-
211
-
212
-
213
-
214
-
215
-
216
-
217
-
218
-
219
-
220
-
221
-
222
-
223
-
224
-
225
-
226
-
227
-
228
-
229
-
230
-
231
-
 232
232 -
 233
233 -
 234
234 -
 235
235 -
 236
236 -
 237
237 -
 238
238 -
 239
239 -
 240
240 -
 241
241 -
 242
242 -
 243
243 -
 244
244 -
 245
245 -
 246
246 -
 247
247 -
 248
248 -
 249
249 -
 250
250 -
 251
251 -
 252
252 -
253
-
254
-
255
-
256
 |
 |

240 Bank of America 2015
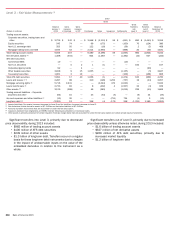
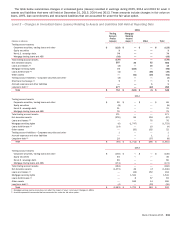
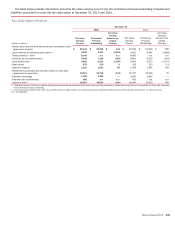
The following tables provide information about where changes in the fair value of assets and liabilities accounted for under the fair
value option are included in the Consolidated Statement of Income for 2015, 2014 and 2013.
Gains (Losses) Relating to Assets and Liabilities Accounted for Under the Fair Value Option
2015
(Dollars in millions)
Trading
Account
Profits
(Losses)
Mortgage
Banking
Income
(Loss)
Other
Income
(Loss) Total
Federal funds sold and securities borrowed or purchased under agreements to resell $ (195) $ — $ —$ (195)
Loans reported as trading account assets (199) — —(199)
Trading inventory – other (1) 1,284 — —1,284
Consumer and commercial loans 52 — (295) (243)
Loans held-for-sale (2) (36) 673 63 700
Other assets — — 10 10
Long-term deposits 1 — 13 14
Federal funds purchased and securities loaned or sold under agreements to repurchase 33 — —33
Short-term borrowings 3 — —3
Unfunded loan commitments — — (210) (210)
Long-term debt (3, 4) 2,107 — (633) 1,474
Total $ 3,050 $ 673 $(1,052) $ 2,671
2014
Federal funds sold and securities borrowed or purchased under agreements to resell $ (114) $ — $ — $ (114)
Loans reported as trading account assets (87) — — (87)
Trading inventory – other (1) 1,091 — — 1,091
Consumer and commercial loans (24) — 69 45
Loans held-for-sale (2) (56) 798 83 825
Long-term deposits 23 — (26) (3)
Federal funds purchased and securities loaned or sold under agreements to repurchase 4 — — 4
Short-term borrowings 52 — — 52
Unfunded loan commitments — — (64) (64)
Long-term debt (3) 239 — 407 646
Total $ 1,128 $ 798 $ 469 $ 2,395
2013
Federal funds sold and securities borrowed or purchased under agreements to resell $ (44) $ — $ — $ (44)
Loans reported as trading account assets 83 — — 83
Trading inventory – other (1) 1,355 — — 1,355
Consumer and commercial loans (28) (38) 240 174
Loans held-for-sale (2) 7 966 75 1,048
Other assets — — (77) (77)
Long-term deposits 30 — 84 114
Federal funds purchased and securities loaned or sold under agreements to repurchase (36) — — (36)
Asset-backed secured financings — (91) — (91)
Short-term borrowings (70) — — (70)
Unfunded loan commitments — — 180 180
Long-term debt (3) (602) — (649) (1,251)
Total $ 695 $ 837 $ (147) $ 1,385
(1) The gains (losses) in trading account profits (losses) are primarily offset by gains (losses) on trading liabilities that hedge these assets.
(2) Includes the value of IRLCs on funded loans, including those sold during the period.
(3) The majority of the net gains (losses) in trading account profits relate to the embedded derivative in structured liabilities and are offset by gains (losses) on derivatives and securities that hedge
these liabilities. In connection with the implementation of new accounting guidance relating to DVA on structured liabilities accounted for at fair value under the fair value option, unrealized DVA gains
(losses) in 2015 are recorded in accumulated OCI while realized gains (losses) are recorded in other income (loss); for years prior to 2015, the realized and unrealized gains (losses) are reflected
in other income (loss). For more information on the implementation of new accounting guidance, see Note 1 – Summary of Significant Accounting Principles.
(4) For the cumulative impact of changes in the Corporation’s credit spreads and the amount recognized in OCI, see Note 14 – Accumulated Other Comprehensive Income (Loss). For more information on
how the Corporation’s own credit spread is determined, see Note 20 – Fair Value Measurements.
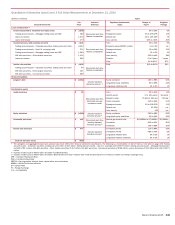
Gains (Losses) Related to Borrower-specific Credit Risk for Assets Accounted for Under the Fair Value Option
December 31
(Dollars in millions) 2015 2014 2013
Loans reported as trading account assets $ 37 $ 28 $ 56
Consumer and commercial loans (200) 32 148
Loans held-for-sale 37 84 225