Philips 2009 Annual Report Download - page 102
Download and view the complete annual report
Please find page 102 of the 2009 Philips annual report below. You can navigate through the pages in the report by either clicking on the pages listed below, or by using the keyword search tool below to find specific information within the annual report.-
 1
1 -
2
-
3
-
4
-
5
-
6
-
7
-
8
-
9
-
10
-
11
-
12
-
13
-
14
-
15
-
16
-
17
-
18
-
19
-
20
-
21
-
22
-
23
-
24
-
25
-
26
-
27
-
28
-
29
-
30
-
31
-
32
-
33
-
34
-
35
-
36
-
37
-
38
-
39
-
40
-
41
-
42
-
43
-
44
-
45
-
46
-
47
-
48
-
49
-
50
-
51
-
52
-
53
-
54
-
55
-
56
-
57
-
58
-
59
-
60
-
61
-
62
-
63
-
64
-
65
-
66
-
67
-
68
-
69
-
70
-
71
-
72
-
73
-
74
-
75
-
76
-
77
-
78
-
79
-
80
-
81
-
82
-
83
-
84
-
85
-
86
-
87
-
88
-
89
-
90
-
91
-
 92
92 -
 93
93 -
 94
94 -
 95
95 -
 96
96 -
 97
97 -
 98
98 -
 99
99 -
 100
100 -
 101
101 -
 102
102 -
 103
103 -
 104
104 -
 105
105 -
 106
106 -
 107
107 -
 108
108 -
 109
109 -
 110
110 -
 111
111 -
 112
112 -
113
-
114
-
115
-
116
-
117
-
118
-
119
-
120
-
121
-
122
-
123
-
124
-
125
-
126
-
127
-
128
-
129
-
130
-
131
-
132
-
133
-
134
-
135
-
136
-
137
-
138
-
139
-
140
-
141
-
142
-
143
-
144
-
145
-
146
-
147
-
148
-
149
-
150
-
151
-
152
-
153
-
154
-
155
-
156
-
157
-
158
-
159
-
160
-
161
-
162
-
163
-
164
-
165
-
166
-
167
-
168
-
169
-
170
-
171
-
172
-
173
-
174
-
175
-
176
-
177
-
178
-
179
-
180
-
181
-
182
-
183
-
184
-
185
-
186
-
187
-
188
-
189
-
190
-
191
-
192
-
193
-
194
-
195
-
196
-
197
-
198
-
199
-
200
-
201
-
202
-
203
-
204
-
205
-
206
-
207
-
208
-
209
-
210
-
211
-
212
-
213
-
214
-
215
-
216
-
217
-
218
-
219
-
220
-
221
-
222
-
223
-
224
-
225
-
226
-
227
-
228
-
229
-
230
-
231
-
232
-
233
-
234
-
235
-
236
-
237
-
238
-
239
-
240
-
241
-
242
-
243
-
244
 |
 |

5.5.5 Philips Design
Philips Design is one of the longest-established design
organizations of its kind in the world. It is headquartered
in Eindhoven, Netherlands, with branch studios in Europe,
the US and Asia Pacific. Its creative force comprises
designers, psychologists, ergonomists, sociologists,
philosophers and anthropologists working together to
understand people’s needs and desires, in order to
generate designs which support people in accomplishing
and experiencing things in natural, intuitive ways.
Philips Design’s forward-looking exploration projects
deliver vital insights for new business development,
supporting the transformation towards a Health and
Well-being company.
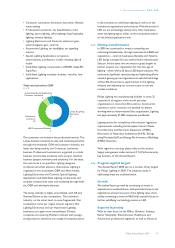
5.5.6 2009 financial performance
Our Incubator activities are now maturing and
increasingly aligned with the growth plans of our individual
sectors. As a result, in 2009, charges related to the early-
stage ventures are included in the Research and
Development costs of the respective sectors.
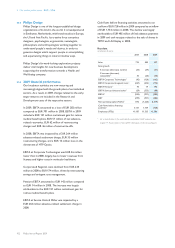
In 2009, EBITA amounted to a loss of EUR 282 million
compared to EUR 701 million in 2008. EBITA in 2009
included a EUR 131 million curtailment gain for retiree
medical benefit plans, EUR 57 million of net asbestos-
related recoveries, EUR 62 million of restructuring
charges and EUR 46 million of asset write-offs.
In 2008, EBITA was impacted by a EUR 264 million
asbestos-related settlement charge, EUR 35 million
restructuring charges, and a EUR 13 million loss on the
divestment of HTP Optics.
EBITA at Corporate Technologies was EUR 36 million
lower than in 2008, largely due to lower revenues from
licenses and higher costs in molecular healthcare.
Corporate & Regional costs declined from EUR 234
million in 2008 to EUR 174 million, driven by restructuring
savings and stringent cost management.
Pensions EBITA amounted to EUR 142 million compared
to EUR 14 million in 2008. The increase was largely
attributable to the EUR 131 million curtailment gain for
retiree medical benefit plans.
EBITA at Service Units & Other was impacted by a
EUR 264 million asbestos-related settlement charge in
2008.
Cash flows before financing activities amounted to an
outflow of EUR 728 million in 2009 compared to an inflow
of EUR 1,734 million in 2008. The decline was largely
attributable to EUR 485 million of final asbestos payments
in 2009 and cash receipts related to the sale of shares in
TSMC and LG Display in 2008.
Key data
in millions of euros
2007 2008 2009
Sales 732 485 337
Sales growth
% increase (decrease), nominal (53) (34) (31)
% increase (decrease),
comparable1) 36 (26) (30)
EBITA Corporate Technologies1) (42) (126) (162)
EBITA Corporate & regional costs1) (267) (234) (174)
EBITA Pensions1) 43 14 142
EBITA Services Units and other1) (29) (355) (88)
EBITA1) (295) (701) (282)
EBIT (295) (701) (282)
Net operating capital (NOC)1) 872 (1,226) (1,514)
Cash flows before financing
activities1) 5,151 1,734 (728)
Employees (FTEs) 11,187 11,335 11,586
1) For a reconciliation to the most directly comparable GAAP measures, see
chapter 14, Reconciliation of non-GAAP information, of this Annual Report.
5 Our sector performance 5.5.5 - 5.5.6
102 Philips Annual Report 2009