Philips 2009 Annual Report Download - page 190
Download and view the complete annual report
Please find page 190 of the 2009 Philips annual report below. You can navigate through the pages in the report by either clicking on the pages listed below, or by using the keyword search tool below to find specific information within the annual report.-
 1
1 -
2
-
3
-
4
-
5
-
6
-
7
-
8
-
9
-
10
-
11
-
12
-
13
-
14
-
15
-
16
-
17
-
18
-
19
-
20
-
21
-
22
-
23
-
24
-
25
-
26
-
27
-
28
-
29
-
30
-
31
-
32
-
33
-
34
-
35
-
36
-
37
-
38
-
39
-
40
-
41
-
42
-
43
-
44
-
45
-
46
-
47
-
48
-
49
-
50
-
51
-
52
-
53
-
54
-
55
-
56
-
57
-
58
-
59
-
60
-
61
-
62
-
63
-
64
-
65
-
66
-
67
-
68
-
69
-
70
-
71
-
72
-
73
-
74
-
75
-
76
-
77
-
78
-
79
-
80
-
81
-
82
-
83
-
84
-
85
-
86
-
87
-
88
-
89
-
90
-
91
-
92
-
93
-
94
-
95
-
96
-
97
-
98
-
99
-
100
-
101
-
102
-
103
-
104
-
105
-
106
-
107
-
108
-
109
-
110
-
111
-
112
-
113
-
114
-
115
-
116
-
117
-
118
-
119
-
120
-
121
-
122
-
123
-
124
-
125
-
126
-
127
-
128
-
129
-
130
-
131
-
132
-
133
-
134
-
135
-
136
-
137
-
138
-
139
-
140
-
141
-
142
-
143
-
144
-
145
-
146
-
147
-
148
-
149
-
150
-
151
-
152
-
153
-
154
-
155
-
156
-
157
-
158
-
159
-
160
-
161
-
162
-
163
-
164
-
165
-
166
-
167
-
168
-
169
-
170
-
171
-
172
-
173
-
174
-
175
-
176
-
177
-
178
-
179
-
 180
180 -
 181
181 -
 182
182 -
 183
183 -
 184
184 -
 185
185 -
 186
186 -
 187
187 -
 188
188 -
 189
189 -
 190
190 -
 191
191 -
 192
192 -
 193
193 -
 194
194 -
 195
195 -
 196
196 -
 197
197 -
 198
198 -
 199
199 -
 200
200 -
201
-
202
-
203
-
204
-
205
-
206
-
207
-
208
-
209
-
210
-
211
-
212
-
213
-
214
-
215
-
216
-
217
-
218
-
219
-
220
-
221
-
222
-
223
-
224
-
225
-
226
-
227
-
228
-
229
-
230
-
231
-
232
-
233
-
234
-
235
-
236
-
237
-
238
-
239
-
240
-
241
-
242
-
243
-
244
 |
 |

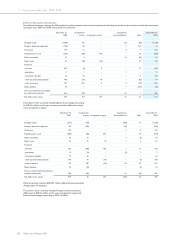
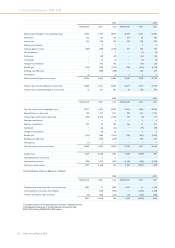
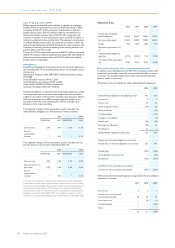
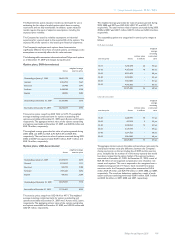
2008 2009
Netherlands other total Netherlands other total
Defined-benefit obligation at the beginning of year 11,260 7,419 18,679 10,394 6,452 16,846
Service cost 135 84 219 107 75 182
Interest cost 524 398 922 532 395 927
Employee contributions − 4 4 − 4 4
Actuarial (gains) or losses (789) (393) (1,182) 371 424 795
Plan amendments − 1 1 − (7) (7)
Settlements − (22) (22) − (95) (95)
Curtailments − (1) (1) − (5) (5)
Changes in consolidation − 106 106 − (33) (33)
Benefits paid (733) (457) (1,190) (725) (422) (1,147)
Exchange rate differences − (688) (688) − 249 249
Miscellaneous (3) 1 (2) 2 2 4
Defined-benefit obligation at end of year 10,394 6,452 16,846 10,681 7,039 17,720
Present value of funded obligations at end of year 10,384 5,701 16,085 10,671 6,319 16,990
Present value of unfunded obligations at end of year 10 751 761 10 720 730
2008 2009
Netherlands other total Netherlands other total
Fair value of plan assets at beginning of year 13,771 6,429 20,200 13,003 4,896 17,899
Expected return on plan assets 769 392 1,161 758 343 1,101
Actuarial gains and (losses) on plan assets (942) (1,013) (1,955) 125 (8) 117
Employee contributions − 4 4 − 4 4
Employer contributions 136 48 184 166 51 217
Settlements − (22) (22) − (94) (94)
Changes in consolidation − 88 88 − 2 2
Benefits paid (730) (383) (1,113) (723) (352) (1,075)
Exchange rate differences − (649) (649) − 299 299
Miscellaneous (1) 2 1 − − −
Fair value of plan assets at end of year 13,003 4,896 17,899 13,329 5,141 18,470
Funded status 2,609 (1,556) 1,053 2,648 (1,898) 750
Unrecognized prior-service cost − 3 3 − − −
Unrecognized net assets (782) (111) (893) (1,161) (133) (1,294)
Net balance sheet position 1,827 (1,664) 163 1,487 (2,031) (544)
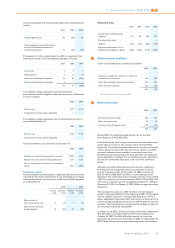
The classification of the net balance is as follows:
2008 2009
Netherlands other total Netherlands other total
Prepaid pension costs under other non-current assets 1,837 21 1,858 1,497 21 1,518
Accrued pension costs under other liabilities − (932) (932) − (1,332) (1,332)
Provision for pensions under provisions (10) (753) (763) (10) (720) (730)
1,827 (1,664) 163 1,487 (2,031) (544)
Cumulative amount of actuarial (gains) and losses recognized in the
Consolidated statements of comprehensive income (pre tax):
EUR 1,767 million (2008: EUR 1,026 million).
11 Group financial statements 11.12 - 11.12
190 Philips Annual Report 2009