Philips 2009 Annual Report Download - page 217
Download and view the complete annual report
Please find page 217 of the 2009 Philips annual report below. You can navigate through the pages in the report by either clicking on the pages listed below, or by using the keyword search tool below to find specific information within the annual report.-
 1
1 -
2
-
3
-
4
-
5
-
6
-
7
-
8
-
9
-
10
-
11
-
12
-
13
-
14
-
15
-
16
-
17
-
18
-
19
-
20
-
21
-
22
-
23
-
24
-
25
-
26
-
27
-
28
-
29
-
30
-
31
-
32
-
33
-
34
-
35
-
36
-
37
-
38
-
39
-
40
-
41
-
42
-
43
-
44
-
45
-
46
-
47
-
48
-
49
-
50
-
51
-
52
-
53
-
54
-
55
-
56
-
57
-
58
-
59
-
60
-
61
-
62
-
63
-
64
-
65
-
66
-
67
-
68
-
69
-
70
-
71
-
72
-
73
-
74
-
75
-
76
-
77
-
78
-
79
-
80
-
81
-
82
-
83
-
84
-
85
-
86
-
87
-
88
-
89
-
90
-
91
-
92
-
93
-
94
-
95
-
96
-
97
-
98
-
99
-
100
-
101
-
102
-
103
-
104
-
105
-
106
-
107
-
108
-
109
-
110
-
111
-
112
-
113
-
114
-
115
-
116
-
117
-
118
-
119
-
120
-
121
-
122
-
123
-
124
-
125
-
126
-
127
-
128
-
129
-
130
-
131
-
132
-
133
-
134
-
135
-
136
-
137
-
138
-
139
-
140
-
141
-
142
-
143
-
144
-
145
-
146
-
147
-
148
-
149
-
150
-
151
-
152
-
153
-
154
-
155
-
156
-
157
-
158
-
159
-
160
-
161
-
162
-
163
-
164
-
165
-
166
-
167
-
168
-
169
-
170
-
171
-
172
-
173
-
174
-
175
-
176
-
177
-
178
-
179
-
180
-
181
-
182
-
183
-
184
-
185
-
186
-
187
-
188
-
189
-
190
-
191
-
192
-
193
-
194
-
195
-
196
-
197
-
198
-
199
-
200
-
201
-
202
-
203
-
204
-
205
-
206
-
 207
207 -
 208
208 -
 209
209 -
 210
210 -
 211
211 -
 212
212 -
 213
213 -
 214
214 -
 215
215 -
 216
216 -
 217
217 -
 218
218 -
 219
219 -
 220
220 -
 221
221 -
 222
222 -
 223
223 -
 224
224 -
 225
225 -
 226
226 -
 227
227 -
228
-
229
-
230
-
231
-
232
-
233
-
234
-
235
-
236
-
237
-
238
-
239
-
240
-
241
-
242
-
243
-
244
 |
 |

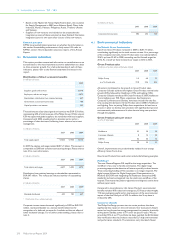
In addition to our environmental initiatives we have been running
programs in other areas. Our employee programs include engagement,
diversity and inclusion, and health and safety. Through our Supplier
Sustainability Involvement Program we have been embedding
sustainability into our supply management processes since 2003.
Further, we have a targeted approach to our social investment program
that reflects our business. In keeping with this we direct our efforts
toward projects to install energy-efficient lighting, particularly in
schools, as well as provide information on how to improve health and
well-being through exercise, food, sleep and personal hygiene. We also
support healthcare projects that focus on children.
Scope of sustainability reporting
The scope of our sustainability performance reporting encompasses the
consolidated Philips Group activities, following the consolidation
criteria detailed in this section.
The consolidated selected financial information in this sustainability
performance chapter has been derived from International Financial
Reporting Standards (IFRS) as adopted by the European Union (EU).
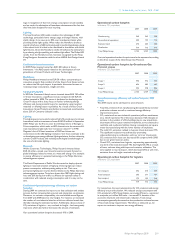
Comparability and completeness
For comparability reasons, all economic, environmental and social
performance data exclude the former activities of the Semiconductors
sector, which was divested in September 2006.
Environmental data are measured for those manufacturing sites with
more than 50 industrial employees. Integration of newly acquired
manufacturing sites is scheduled according to a defined integration
timetable (in principle, first full reporting year after the year of
acquisition) and subject to management decision. Data for activities that
are divested during the reporting year are not included in full-year
reporting.
Social data cover all employees, including temporary employees, but
exclude contract workers. Due to the implementation of new HRM
systems, we are able to provide additional information on Philips
employees for 2009. Historical comparisons, however, may not be
available. Reporting of health and safety data by new acquisitions must,
in principle, start the first year after acquisition and subject to
management decision. Data for activities that are divested during the
reporting year are not included in full-year reporting.
Data definitions and scope
Green Products
Green Products offer a significant environmental improvement in one
or more Green Focal Areas: Energy efficiency, Packaging, Hazardous
substances, Weight, Recycling and disposal and Lifetime reliability. The
life cycle approach is used to determine a product’s overall
environmental improvement. It calculates the environmental impact of
a product over its total life cycle (raw materials, manufacturing, product
use and disposal).
Green Products need to have a score in at least one Green Focal Area
that is significantly better (at least 10%), compared to the reference
product, which can be a competitor or predecessor product in the
particular product family. Because of different product portfolios,
sectors have specified additional criteria for Green Products.
Green Innovations
Green Innovations comprise all R&D activities directly contributing to
the development of Green Products or Green Technologies. A wide set
of additional criteria and boundaries have been defined as the basis for
internal and external validation.
Environmental data
All environmental data from manufacturing operations are reported on
a half-year basis in our intranet-based EcoVision reporting and
validation tool, according to defined company guidelines that include
definitions, procedures and calculation methods.
Internal validation processes are followed to ensure consistent data
quality. The sector validation officers provide support to the data
collectors at site level and regularly conduct audits to assess the
robustness of data reporting systems.
These EcoVision data from manufacturing are tracked and reported to
measure progress against our EcoVision III program targets.
Reporting on ISO certification is based on manufacturing units
reporting in EcoVision.
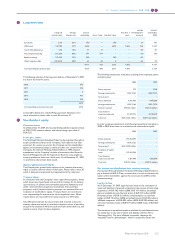
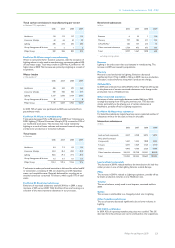
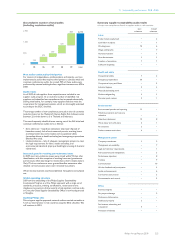
Operational carbon footprint
The Philips operational carbon footprint includes:
• Industrial – manufacturing and assembly sites
• Non-industrial – offices, warehouses, IT centers and R&D facilities
• Business travel – lease and rental cars, and airplane travel
• Logistics – air, sea and road transport.
All emission factors used to transform input data (for example, amount
of ton-kilometers) into CO2 emissions are from the Greenhouse Gas
Protocol, except for business travel, where the providers supplied CO2
data based on their own methodology. The Greenhouse Gas Protocol
distinguishes three scopes. It is mandatory to report on the first two.
• Scope 1 – direct CO2 emissions – is completely reported on with
direct emissions from our industrial and non-industrial sites.
Emissions from industrial sites, which consist of direct emissions
resulting from processes and fossil fuel combustion on site, are
reported in the EcoVision reporting system. Emissions from
industrial sites that are not yet reporting in EcoVision following
recent acquisitions are collected separately, or in case actual data is
not available, calculated based on average CO2 emissions per square
meter of comparable sites in the same sector. Energy use and CO2
emissions from non-industrial sites are based on actual data where
available. If this is not the case, they are estimated based on square
meters, taking the geographical location of the site into account.
• Scope 2 – CO2 emissions resulting from the generation of purchased
electricity for our premises – is completely reported on with
electricity use from industrial and non-industrial sites. Indirect CO2
emissions resulting from purchased electricity, steam and heat are
reported in the EcoVision reporting system. These emissions of
industrial sites not yet reporting in EcoVision are calculated on the
same basis as described in Scope 1. Indirect emissions of non-
industrial sites are calculated in the same manner as described in
Scope 1.
• Scope 3 – other CO2 emissions related to activities not owned or
controlled by the company is reported on for our business travel and
distribution activities. Commuting by our employees, upstream
distribution (before suppliers ship to us), outsourced activities and
emissions resulting from product use by our customers are not
included in our operational carbon footprint. The calculations for
business travel by lease and rental cars are based on actual fuel usage.
Emissions from business travel by airplane are calculated by the
supplier based on mileage flown and emission factors from DEFRA
(UK Department of Environment, Food and Rural Affairs)
distinguishing between short, medium and long flights. Further,
emissions from air freight for distribution are calculated based on the
amount of ton-kilometers transported between airports
(distinguishing between short, medium and long hauls), including an
estimate (based on actual data of the lanes with the largest volumes)
for trucking from sites and distribution centers to airports and vice
versa. For sea transport, only data on transported volume were
available so an estimate had to be made about the average weight of a
container. Transportation to and from ports is not registered. This
fore and aft part of air and sea transport was estimated to be around
3.5% of the total distance (based on actual data of the lanes with the
largest volumes), consisting of a mix of modalities, and was added to
the total emissions accordingly. CO2 emissions from road transport
were also calculated based on ton-kilometers. If data were
incomplete, the emissions were estimated based on sales volumes.
Return travel is not included in the data for sea and road distribution.
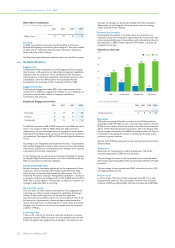
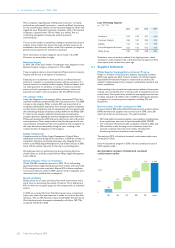
Health and safety
Health and safety data are reported monthly and validated on a half-
yearly basis. The focus is on reporting work-related injuries, which
predominantly occur in manufacturing operations. The annual number
of cases leading to at least one lost workday is reported per 100 FTEs
(full-time equivalents).
Supplier audits
Supplier audits are primarily focused on identified risk suppliers, based
on identified risk countries and on spend of more than EUR 100,000.
13 Sustainability performance 13.1 - 13.1
Philips Annual Report 2009 217