Philips 2009 Annual Report Download - page 207
Download and view the complete annual report
Please find page 207 of the 2009 Philips annual report below. You can navigate through the pages in the report by either clicking on the pages listed below, or by using the keyword search tool below to find specific information within the annual report.-
 1
1 -
2
-
3
-
4
-
5
-
6
-
7
-
8
-
9
-
10
-
11
-
12
-
13
-
14
-
15
-
16
-
17
-
18
-
19
-
20
-
21
-
22
-
23
-
24
-
25
-
26
-
27
-
28
-
29
-
30
-
31
-
32
-
33
-
34
-
35
-
36
-
37
-
38
-
39
-
40
-
41
-
42
-
43
-
44
-
45
-
46
-
47
-
48
-
49
-
50
-
51
-
52
-
53
-
54
-
55
-
56
-
57
-
58
-
59
-
60
-
61
-
62
-
63
-
64
-
65
-
66
-
67
-
68
-
69
-
70
-
71
-
72
-
73
-
74
-
75
-
76
-
77
-
78
-
79
-
80
-
81
-
82
-
83
-
84
-
85
-
86
-
87
-
88
-
89
-
90
-
91
-
92
-
93
-
94
-
95
-
96
-
97
-
98
-
99
-
100
-
101
-
102
-
103
-
104
-
105
-
106
-
107
-
108
-
109
-
110
-
111
-
112
-
113
-
114
-
115
-
116
-
117
-
118
-
119
-
120
-
121
-
122
-
123
-
124
-
125
-
126
-
127
-
128
-
129
-
130
-
131
-
132
-
133
-
134
-
135
-
136
-
137
-
138
-
139
-
140
-
141
-
142
-
143
-
144
-
145
-
146
-
147
-
148
-
149
-
150
-
151
-
152
-
153
-
154
-
155
-
156
-
157
-
158
-
159
-
160
-
161
-
162
-
163
-
164
-
165
-
166
-
167
-
168
-
169
-
170
-
171
-
172
-
173
-
174
-
175
-
176
-
177
-
178
-
179
-
180
-
181
-
182
-
183
-
184
-
185
-
186
-
187
-
188
-
189
-
190
-
191
-
192
-
193
-
194
-
195
-
196
-
 197
197 -
 198
198 -
 199
199 -
 200
200 -
 201
201 -
 202
202 -
 203
203 -
 204
204 -
 205
205 -
 206
206 -
 207
207 -
 208
208 -
 209
209 -
 210
210 -
 211
211 -
 212
212 -
 213
213 -
 214
214 -
 215
215 -
 216
216 -
 217
217 -
218
-
219
-
220
-
221
-
222
-
223
-
224
-
225
-
226
-
227
-
228
-
229
-
230
-
231
-
232
-
233
-
234
-
235
-
236
-
237
-
238
-
239
-
240
-
241
-
242
-
243
-
244
 |
 |

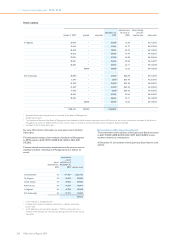
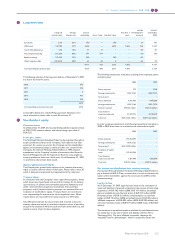
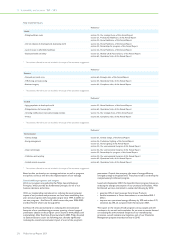
The table below analyses financial instruments carried at fair value, by
different hierarchy levels:
Fair value hierarchy
level 1 level 2 level 3 total
December 31, 2009
Available-for-sale financial
assets - non-current 244 61 − 305
Available-for-sale financial
assets - current − 145 − 145
Financial assets designated at
fair value through profit and
loss - non-current 30 2 − 32
Financial asses designated at
fair value through profit and
loss - current − 25 − 25
Derivative financial
instruments - assets − 102 − 102
Total financial assets carried at
fair value 274 335 − 609
Derivative financial
instruments - liabilities − (276) − (276)
December 31, 2008
Available-for-sale financial
assets - non-current 599 183 − 782
Financial assets designated at
fair value through profit and
loss - non-current 26 10 − 36
Derivative financial
instruments - assets − 253 − 253
Total financial assets carried at
fair value 625 446 − 1,071
Derivative financial
instruments - liabilities − (505) − (505)
Specific valuation techniques used to value financial instruments include:
Level 1
Instruments included in level 1 are comprised primarily of listed equity
investments classified as available-for-sale financial assets, investees and
financial assets designated at fair value through profit and loss.
The fair value of financial instruments traded in active markets is based
on quoted market prices at the balance sheet date. A market is regarded
as active if quoted prices are readily and regularly available from an
exchange, dealer, broker, industry group, pricing service, or regulatory
agency, and those prices represent actual and regularly occurring
market transactions on an arm’s length basis. During 2009, certain
equity investments were reclassified to level 1 due to a more reliable
active market price becoming available.
Level 2
The fair value of financial instruments that are not traded in an active
market (for example, over-the-counter derivatives or convertible bond
instruments) are determined by using valuation techniques. These
valuation techniques maximize the use of observable market data
where it is available and rely as little as possible on entity-specific
estimates. If all significant inputs required to fair value an instrument are
observable, the instrument is included in level 2.
The fair value of derivatives is calculated as the present value of the
estimated future cash flows based on observable yield curves.
The valuation of convertible bond instruments uses observable market
quoted data for the options and present value calculations using
observable yield curves for the fair value of the bonds.
Level 3
If one or more of the significant inputs are not based on observable
market data, the instrument is included in level 3. At the end of 2009,
there are no financial assets nor liabilities carried at fair value classified
as level 3.
For cash and cash equivalents, current receivables, current payables,
interest accrual and short-term debts, the carrying amounts
approximate fair value because of the short maturity of these
instruments.
33 Other financial instruments
The Company uses foreign exchange derivatives such as forwards and/
or options to manage currency risk. Changes in the value of foreign
currency accounts receivable/payable as well as the changes in the fair
value of the hedges of accounts receivable/payable are reported in the
Consolidated statements of income under Cost of sales. The hedges
related to forecasted transactions, where hedge accounting is applied,
are recorded as cash flow hedges. The effective part of the fair value
changes from such hedges are deferred within Other comprehensive
income in Stockholders’ equity. As of December 31, 2009, a gain of EUR
10 million was deferred in Stockholders’ equity as a result of these
hedges and during 2009 a gain of EUR 7 million was recorded in the
Consolidated statements of income as a result of ineffectiveness of the
cash flow hedges.
Changes in the fair value of hedges related to external and
intercompany debt and deposits are recognized within Financial income
and expenses in the Consolidated statements of income. The changes in
the fair value of these hedges related to foreign exchange movements
are largely offset in the Consolidated statements of income by changes
in the fair value of the hedged items.
The Company does not hedge the exposure arising from translation
exposure of net income in foreign entities. Translation exposure of
equity invested in consolidated foreign entities financed by equity is
partially hedged. If a hedge is entered into, it is accounted for as a net
investment hedge. During 2009, Philips recorded a gain of less than
EUR 1 million in Other comprehensive income under currency
translation differences as a result. Currently, there are no oustanding
net investment hedges.
The Company hedges certain commodity price risks using derivative
instruments to minimize significant, unanticipated earnings fluctuations
caused by commodity price volatility. The commodity price derivatives
that Philips enters into are normally concluded as cash flow hedges to
offset forecasted purchases.
Philips has two major embedded derivatives included in two convertible
notes. One was issued to Philips in September 2005 by TPV Technology
Ltd., the face value of the bond being EUR 146 million and the value of
the option at year-end EUR 25 million. Changes in the value of the
embedded derivative were reported in Financial income and expenses
as EUR 17 million gain in 2009. A further convertible bond was issued to
Philips in August 2008 by CBAY, the face value of the bond being EUR
67 million and the value of the option at year-end EUR 2 million.
Changes in the value of the embedded derivative were reported in
Financial income and expenses as a EUR 2 million gain in 2009.
Please refer to section 6.7.2, Details of treasury risks, of this Annual
Report for Philips’ risk management policies and further details.
34 Subsequent events
Sale of shares in TPV Technology Ltd.
On January 29, 2010, Philips announced that it sold most of its stake in
Hong Kong based technology provider TPV Technology Ltd to CEIEC
(H.K.) Ltd, a subsidiary of CEC/Great Wall, in an off-market transaction.
This transaction, which is subject to the buyers obtaining applicable
consents, authorizations and approvals from the relevant government
authorities of the People’s Republic of China, represented 9% of TPV’s
issued share capital and reduced Philips’ shareholding to 3%.
This transaction, which has an approximate break-even impact on the
results, provides Philips with net proceeds of EUR 95 million in the first
quarter of 2010.
11 Group financial statements 11.12 - 11.12 33 34
Philips Annual Report 2009 207