Philips 2009 Annual Report Download - page 220
Download and view the complete annual report
Please find page 220 of the 2009 Philips annual report below. You can navigate through the pages in the report by either clicking on the pages listed below, or by using the keyword search tool below to find specific information within the annual report.-
 1
1 -
2
-
3
-
4
-
5
-
6
-
7
-
8
-
9
-
10
-
11
-
12
-
13
-
14
-
15
-
16
-
17
-
18
-
19
-
20
-
21
-
22
-
23
-
24
-
25
-
26
-
27
-
28
-
29
-
30
-
31
-
32
-
33
-
34
-
35
-
36
-
37
-
38
-
39
-
40
-
41
-
42
-
43
-
44
-
45
-
46
-
47
-
48
-
49
-
50
-
51
-
52
-
53
-
54
-
55
-
56
-
57
-
58
-
59
-
60
-
61
-
62
-
63
-
64
-
65
-
66
-
67
-
68
-
69
-
70
-
71
-
72
-
73
-
74
-
75
-
76
-
77
-
78
-
79
-
80
-
81
-
82
-
83
-
84
-
85
-
86
-
87
-
88
-
89
-
90
-
91
-
92
-
93
-
94
-
95
-
96
-
97
-
98
-
99
-
100
-
101
-
102
-
103
-
104
-
105
-
106
-
107
-
108
-
109
-
110
-
111
-
112
-
113
-
114
-
115
-
116
-
117
-
118
-
119
-
120
-
121
-
122
-
123
-
124
-
125
-
126
-
127
-
128
-
129
-
130
-
131
-
132
-
133
-
134
-
135
-
136
-
137
-
138
-
139
-
140
-
141
-
142
-
143
-
144
-
145
-
146
-
147
-
148
-
149
-
150
-
151
-
152
-
153
-
154
-
155
-
156
-
157
-
158
-
159
-
160
-
161
-
162
-
163
-
164
-
165
-
166
-
167
-
168
-
169
-
170
-
171
-
172
-
173
-
174
-
175
-
176
-
177
-
178
-
179
-
180
-
181
-
182
-
183
-
184
-
185
-
186
-
187
-
188
-
189
-
190
-
191
-
192
-
193
-
194
-
195
-
196
-
197
-
198
-
199
-
200
-
201
-
202
-
203
-
204
-
205
-
206
-
207
-
208
-
209
-
 210
210 -
 211
211 -
 212
212 -
 213
213 -
 214
214 -
 215
215 -
 216
216 -
 217
217 -
 218
218 -
 219
219 -
 220
220 -
 221
221 -
 222
222 -
 223
223 -
 224
224 -
 225
225 -
 226
226 -
 227
227 -
 228
228 -
 229
229 -
 230
230 -
231
-
232
-
233
-
234
-
235
-
236
-
237
-
238
-
239
-
240
-
241
-
242
-
243
-
244
 |
 |

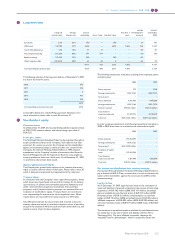
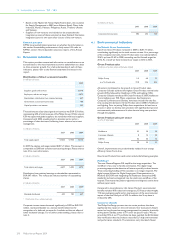
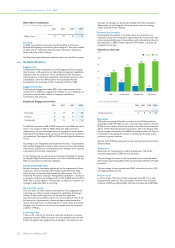
Ratios on carbon emissions and energy use
2007 2008 2009
Operational CO2 emissions in kilotons
CO2-equivalent 2,135 2,139 1,920
Operational CO2 efficiency in tons CO2-
equivalent per million euro sales 79.68 81.05 82.78
Operational energy use in terajoules 34,681 34,586 31,010
Operational energy efficiency in terajoules
per million euro sales 1.29 1.31 1.34
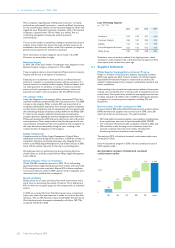
EcoVision III manufacturing targets
Our EcoVision III environmental action program began in 2006 and
officially ended in 2009. Focused on reducing the impact of our
production processes, EcoVision III set reduction targets for all major
environmental parameters in manufacturing compared to the base year
2005.
EcoVision III covers the contributors to climate change (energy, PFCs
and other greenhouse gases), water, waste and a selection of the most
relevant restricted and hazardous substances. We exceeded our Global
Warming Potential reductions, as well as the water and waste targets.
For restricted substances, we reduced the total amount by 88%
compared with 2005, but did not meet the targets for some substances.
For hazardous substances, the total amount decreased significantly.
Progress against our EcoVision III targets is detailed below.
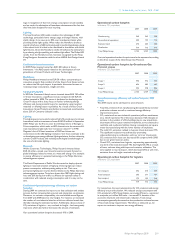
EcoVision III program Process improvements1)
Parameters
unit of measurement reduction target (%) actual reduction (%)
Energy (direct CO2) CO2-equivalent tons 5 16
PFCs CO2-equivalent tons 31 65
Other greenhouse gases CO2-equivalent tons 4 32
Water m3 7 22
Total waste kg 7 27
Restricted substances: Benzene emission kg 100 (579)
Restricted substances: Mercury emission kg 83 53
Restricted substances: CFCs, HCFCs kg 94 99
Other restricted substances (excluding CFCs from cooling systems) kg 100 83
Hazardous substances: Lead emission kg 100 (35)
Hazardous substances: Toluene emission kg 100 88
Hazardous substances: Xylene emission kg 100 (1)
Other hazardous substances kg 100 42
1) Total reduction targets in absolute terms against the base year 2005
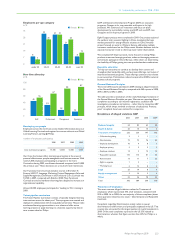
EcoVision III: Energy use in manufacturing
Total energy usage amounted to 14,190 terajoules in 2009. Compared
with 2008, energy consumption at Philips Group level decreased 3%.
Further rationalization of production at Lighting mitigated by newly
reporting sites resulted in a 1% decrease in this sector, which
represents 80% of the total Group. Energy consumption at Consumer
Lifestyle decreased 22% as a result of reduced volumes, relocation of
activities and energy savings initiatives.
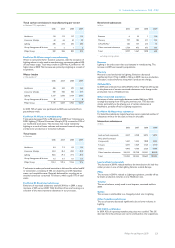
Total energy consumption in manufacturing
in terajoules
2006 2007 2008 2009
Healthcare 1,569 1,600 1,609 1,665
Consumer Lifestyle 1,402 1,444 1,514 1,180
Lighting 12,086 12,091 11,428 11,317
Group Management & Servces 156 36 34 28
Philips Group 15,213 15,171 14,585 14,190
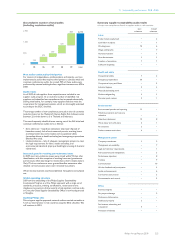
EcoVision III: CO2 emissions in manufacturing
Total CO2 emissions in manufacturing
in kilotons CO2-equivalent
2006 2007 2008 2009
Direct CO2326 321 302 283
Indirect CO2473 465 434 453
Other greenhouse gases1) 40 41 61 54
From glass production 30 29 28 24
Total 869 856 825 814
1) Including PFCs
The greenhouse gas emissions of our manufacturing operations totaled
814 kilotons CO2-equivalent in 2009, 1% lower than 2008. Direct CO2
emissions related to energy use decreased mainly as a result of reduced
volumes, while indirect CO2 emissions increased as a result of
acquisitions. The use of purchased electricity from renewable sources
decreased slightly to 15% as a result of acquisitions and reduced
consumption at sites with renewable electricity.
Consumer Lifestyle achieved a 23% reduction in CO2 emissions,
whereas the other sectors remained stable.
13 Sustainability performance 13.3 - 13.3
220 Philips Annual Report 2009