Philips 2009 Annual Report Download - page 87
Download and view the complete annual report
Please find page 87 of the 2009 Philips annual report below. You can navigate through the pages in the report by either clicking on the pages listed below, or by using the keyword search tool below to find specific information within the annual report.-
 1
1 -
2
-
3
-
4
-
5
-
6
-
7
-
8
-
9
-
10
-
11
-
12
-
13
-
14
-
15
-
16
-
17
-
18
-
19
-
20
-
21
-
22
-
23
-
24
-
25
-
26
-
27
-
28
-
29
-
30
-
31
-
32
-
33
-
34
-
35
-
36
-
37
-
38
-
39
-
40
-
41
-
42
-
43
-
44
-
45
-
46
-
47
-
48
-
49
-
50
-
51
-
52
-
53
-
54
-
55
-
56
-
57
-
58
-
59
-
60
-
61
-
62
-
63
-
64
-
65
-
66
-
67
-
68
-
69
-
70
-
71
-
72
-
73
-
74
-
75
-
76
-
 77
77 -
 78
78 -
 79
79 -
 80
80 -
 81
81 -
 82
82 -
 83
83 -
 84
84 -
 85
85 -
 86
86 -
 87
87 -
 88
88 -
 89
89 -
 90
90 -
 91
91 -
 92
92 -
 93
93 -
 94
94 -
 95
95 -
 96
96 -
 97
97 -
98
-
99
-
100
-
101
-
102
-
103
-
104
-
105
-
106
-
107
-
108
-
109
-
110
-
111
-
112
-
113
-
114
-
115
-
116
-
117
-
118
-
119
-
120
-
121
-
122
-
123
-
124
-
125
-
126
-
127
-
128
-
129
-
130
-
131
-
132
-
133
-
134
-
135
-
136
-
137
-
138
-
139
-
140
-
141
-
142
-
143
-
144
-
145
-
146
-
147
-
148
-
149
-
150
-
151
-
152
-
153
-
154
-
155
-
156
-
157
-
158
-
159
-
160
-
161
-
162
-
163
-
164
-
165
-
166
-
167
-
168
-
169
-
170
-
171
-
172
-
173
-
174
-
175
-
176
-
177
-
178
-
179
-
180
-
181
-
182
-
183
-
184
-
185
-
186
-
187
-
188
-
189
-
190
-
191
-
192
-
193
-
194
-
195
-
196
-
197
-
198
-
199
-
200
-
201
-
202
-
203
-
204
-
205
-
206
-
207
-
208
-
209
-
210
-
211
-
212
-
213
-
214
-
215
-
216
-
217
-
218
-
219
-
220
-
221
-
222
-
223
-
224
-
225
-
226
-
227
-
228
-
229
-
230
-
231
-
232
-
233
-
234
-
235
-
236
-
237
-
238
-
239
-
240
-
241
-
242
-
243
-
244
 |
 |

Deliver value to our customers and
shareholders by effective integration of our
acquisitions
In 2009 we successfully completed the next steps in the
integration of major prior-year acquisitions, notably
Respironics. At the same time we continued to expand
our portfolio with some modest acquisitions. For
instance, we acquired InnerCool Therapies Inc., a pioneer
in the field of therapeutic hypothermia, strengthening our
position in the emergency care market by adding body
temperature management solutions. We also acquired
Traxtal, a medical technology innovator in image-guided
procedures, to strengthen our position as a leading
provider of minimally invasive therapy solutions.
Integration of both acquisitions is progressing well.
Enhance engagement of our workforce
The challenges our sector is currently facing are reflected,
to a degree, in our 2009 employee engagement score.
Overall employee engagement went down to 62%
favorable, from 67% in 2008. However our index
measuring the leadership effectiveness of managers – as
perceived by employees – continued to improve, rising
from 68% in 2008 to 69% in 2009. Furthermore, we have
further strengthened our focus on talent inflow and
leadership development in our emerging markets, one of
the main focus areas for our long-term growth plans.
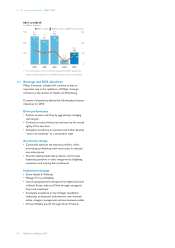
5.2.6 2009 financial performance
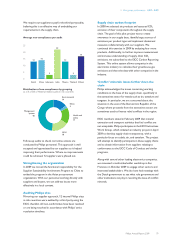
Sales in 2009 amounted to EUR 7,839 million, 2% higher
than in 2008 on a nominal basis, largely thanks to the
contributions from acquired companies (Respironics full-
year sales) and growth at Customer Services. Excluding
the 3% positive impact of portfolio changes and the 3%
favorable impact of currency effects, comparable sales
were lower by 3%. Sales declines were seen at Imaging
Systems, Healthcare Informatics and Clinical Care
Systems while Customer Service and Home Healthcare
Systems grew compared to 2008. Imaging Systems sales
were lower across most modalities except Computed
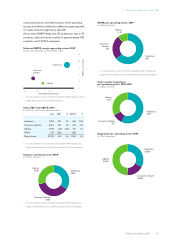
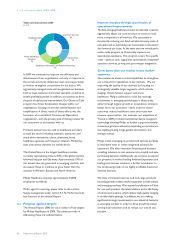
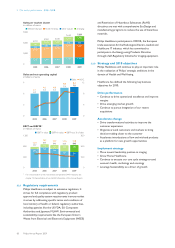
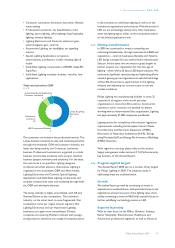
Tomography. Green Product sales amounted to EUR
1,791 million in 2009, up from EUR 1,527 million in 2008,
representing 23% of sector sales.
Geographically, mature market sales were lower than in
2008, led by declines in North America due to the
recession and uncertainty surrounding US healthcare
reform. Emerging markets showed double-digit
comparable sales growth, driven by all businesses. This
growth was attributable to Central and Eastern Europe,
India, the Middle East and China.
EBITA amounted to EUR 848 million, or 10.8% of sales, in
line with 2008 earnings of EUR 839 million. 2009 was
impacted by EUR 42 million of restructuring charges and
EUR 64 million of acquisition-related charges. Earnings in
2008 included EUR 63 million of restructuring charges and
EUR 90 million acquisition-related charges, which were
partly offset by a EUR 45 million gain on the sale of Philips
Speech Recognition Systems. EBITA was driven by
additional income from Customer Services and Home
Healthcare Solutions, offsetting lower earnings at Clinical
Care Systems and Healthcare Informatics. Despite lower
sales, Imaging Systems’ earnings were broadly in line with
2008 as result of strict cost management in the second
part of the year.
Compared to 2008, EBIT declined by EUR 30 million to
EUR 591 million.
Cash flow before financing activities totaled EUR 876
million, an increase of EUR 3,315 million compared with
2008. Last year included net payments totaling EUR 3,456
million, mainly for the acquisitions of Respironics, VISICU,
TOMCAT, Dixtal Biomédica, Shenzhen Goldway, Medel
and Alpha X-Ray Technologies. Excluding acquisition-
related outflows in 2008 and EUR 43 million of cash
proceeds from divestments in 2009, cash flow before
financing activities was EUR 184 million lower than in
2008. The decrease was largely due to lower inflow from
working capital, particularly accounts payable.
Key data
in millions of euros
2007 2008 2009
Sales 6,638 7,649 7,839
Sales growth
% increase, nominal 1 15 2
% increase, comparable 4 6 (3)
EBITA 846 839 848
as a % of sales 12.7 11.0 10.8
EBIT 709 621 591
as a % of sales 10.7 8.1 7.5
Net operating capital (NOC) 4,758 8,785 8,434
Cash flows before financing activities 212 (2,439) 876
Employees (FTEs) 29,191 35,551 34,296
For a reconciliation to the most directly comparable GAAP measures, see chapter
14, Reconciliation of non-GAAP information, of this Annual Report.
5 Our sector performance 5.2.5 - 5.2.6
Philips Annual Report 2009 87