Philips 2009 Annual Report Download - page 68
Download and view the complete annual report
Please find page 68 of the 2009 Philips annual report below. You can navigate through the pages in the report by either clicking on the pages listed below, or by using the keyword search tool below to find specific information within the annual report.-
 1
1 -
2
-
3
-
4
-
5
-
6
-
7
-
8
-
9
-
10
-
11
-
12
-
13
-
14
-
15
-
16
-
17
-
18
-
19
-
20
-
21
-
22
-
23
-
24
-
25
-
26
-
27
-
28
-
29
-
30
-
31
-
32
-
33
-
34
-
35
-
36
-
37
-
38
-
39
-
40
-
41
-
42
-
43
-
44
-
45
-
46
-
47
-
48
-
49
-
50
-
51
-
52
-
53
-
54
-
55
-
56
-
57
-
 58
58 -
 59
59 -
 60
60 -
 61
61 -
 62
62 -
 63
63 -
 64
64 -
 65
65 -
 66
66 -
 67
67 -
 68
68 -
 69
69 -
 70
70 -
 71
71 -
 72
72 -
 73
73 -
 74
74 -
 75
75 -
 76
76 -
 77
77 -
 78
78 -
79
-
80
-
81
-
82
-
83
-
84
-
85
-
86
-
87
-
88
-
89
-
90
-
91
-
92
-
93
-
94
-
95
-
96
-
97
-
98
-
99
-
100
-
101
-
102
-
103
-
104
-
105
-
106
-
107
-
108
-
109
-
110
-
111
-
112
-
113
-
114
-
115
-
116
-
117
-
118
-
119
-
120
-
121
-
122
-
123
-
124
-
125
-
126
-
127
-
128
-
129
-
130
-
131
-
132
-
133
-
134
-
135
-
136
-
137
-
138
-
139
-
140
-
141
-
142
-
143
-
144
-
145
-
146
-
147
-
148
-
149
-
150
-
151
-
152
-
153
-
154
-
155
-
156
-
157
-
158
-
159
-
160
-
161
-
162
-
163
-
164
-
165
-
166
-
167
-
168
-
169
-
170
-
171
-
172
-
173
-
174
-
175
-
176
-
177
-
178
-
179
-
180
-
181
-
182
-
183
-
184
-
185
-
186
-
187
-
188
-
189
-
190
-
191
-
192
-
193
-
194
-
195
-
196
-
197
-
198
-
199
-
200
-
201
-
202
-
203
-
204
-
205
-
206
-
207
-
208
-
209
-
210
-
211
-
212
-
213
-
214
-
215
-
216
-
217
-
218
-
219
-
220
-
221
-
222
-
223
-
224
-
225
-
226
-
227
-
228
-
229
-
230
-
231
-
232
-
233
-
234
-
235
-
236
-
237
-
238
-
239
-
240
-
241
-
242
-
243
-
244
 |
 |
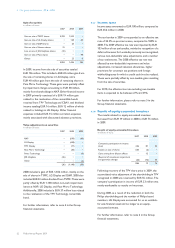
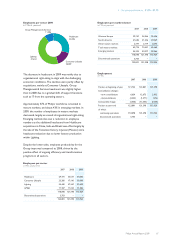
4.2 Liquidity and capital
resources
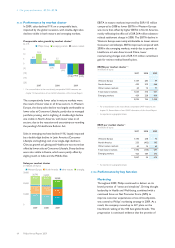
4.2.1 Cash flows provided by continuing
operations
Cash flows from operating activities
Net cash from operating activities amounted to
EUR 1,545 million in 2009, which was EUR 103 million
lower than the operating cash flows generated in 2008.
Higher earnings and lower working capital requirements
in most sectors were more than offset by the final
asbestos settlement payment.
Condensed consolidated statements of cash flows for the
years ended December 31, 2007, 2008 and 2009 are
presented below:
Condensed consolidated cash flow statements
in millions of euros
2007 2008 2009
Cash flows from operating activities:
Net income (loss) attributable to
stockholders 4,873 (91) 410
(Income) loss from discontinued
operations 138 (3) −
Adjustments to reconcile net income
to net cash provided by operating
activities (3,259) 1,742 1,135
Net cash provided by operating
activities 1,752 1,648 1,545
Net cash (used for) provided by
investing activities 3,700 (3,254) (219)
Cash flows before financing activities 5,452 (1,606) 1,326
Net cash used for financing activities (2,371) (3,575) (545)
Cash (used for) provided by
continuing operations 3,081 (5,181) 781
Net cash (used for) discontinued
operations (115) (37) −
Effect of changes in exchange rates on
cash and cash equivalents (112) (39) (15)
Total change in cash and cash
equivalents 2,854 (5,257) 766
Cash and cash equivalents at the
beginning of year 6,023 8,877 3,620
Less cash and cash equivalents at the
end of year - discontinued operations 108 − −
Cash and cash equivalents at the end
of year - continuing operations 8,769 3,620 4,386
Please refer to the consolidated statements of cash flows.
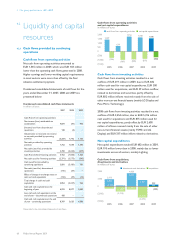
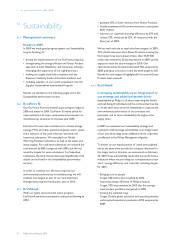
Cash flows from operating activities
and net capital expenditures
in millions of euros
■-cash flows from operating activities--■-net capital expenditures
2,000
1,500
1,000
500
0
(500)
(1,000)
(1,500)
1,407
(746)
2005
639
(987)
2006
1,752
(928)
2007
1,648
(875)
2008
1,545
(682)
2009
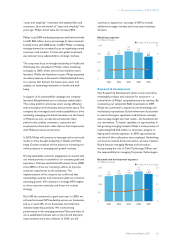
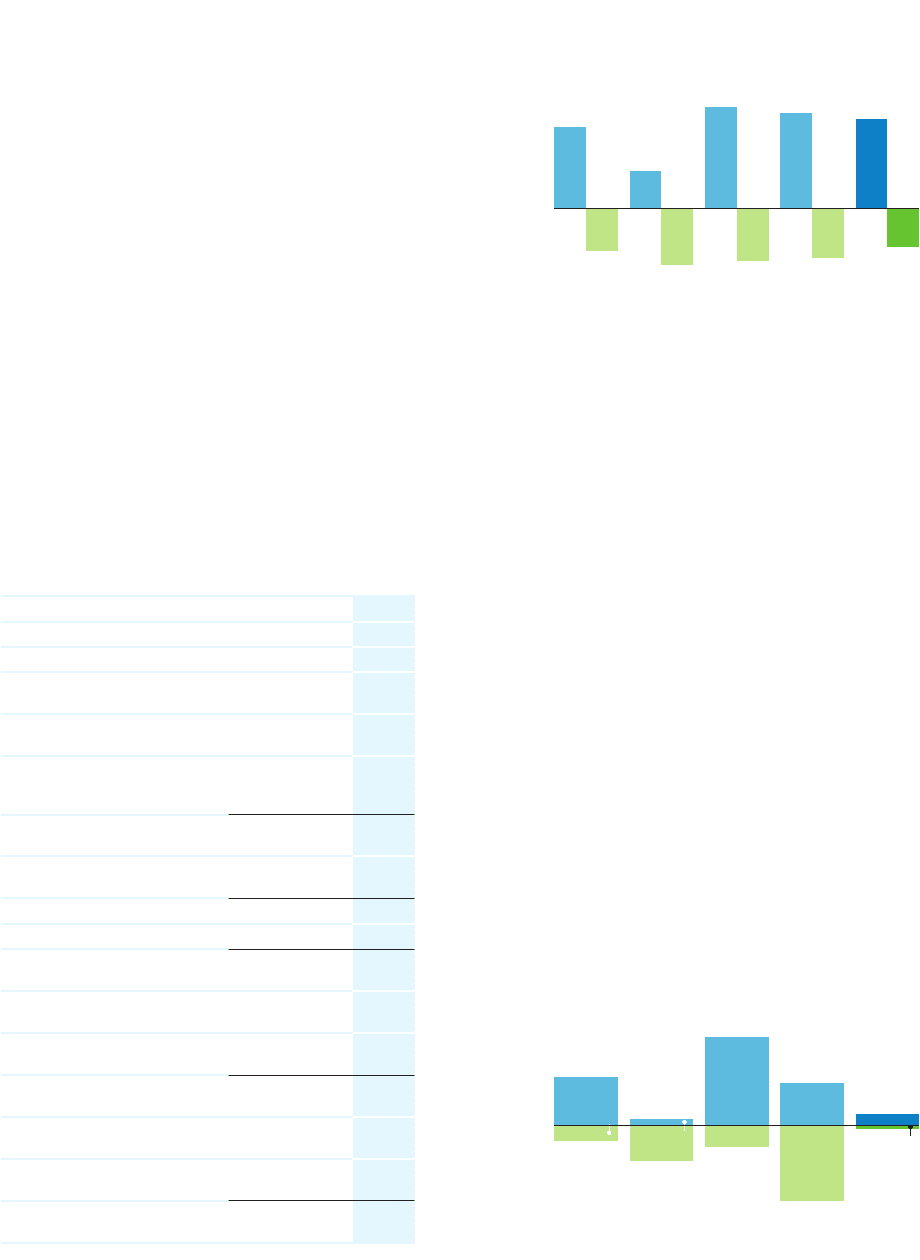
Cash flows from investing activities
Cash flows from investing activities resulted in a net
outflow of EUR 219 million in 2009, due to EUR 682
million cash used for net capital expenditures, EUR 300
million used for acquisitions, and EUR 39 million outflow
related to derivatives and securities, partly offset by
EUR 802 million inflows received mostly from the sale of
other non-current financial assets (mainly LG Display and
Pace Micro Technology).
2008 cash flows from investing activities resulted in a net
outflow of EUR 3,254 million, due to EUR 5,316 million
cash used for acquisitions and EUR 875 million used for
net capital expenditures, partly offset by EUR 2,600
million of inflows received mainly from the sale of other
non-current financial assets (mainly TSMC and LG
Display) and EUR 337 million inflow related to derivatives.
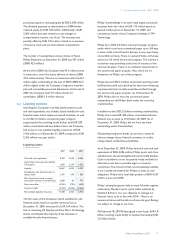
Net capital expenditures
Net capital expenditures totaled EUR 682 million in 2009,
EUR 193 million lower than in 2008, mainly due to lower
investments across all sectors, notably Lighting.
Cash flows from acquisitions,
divestments and derivatives
in millions of euros
■-divestments and derivatives--■-acquisitions
7,000
3,500
0
(3,500)
(7,000)
3,300
(1,107)
2,193
2005
384
(2,498)
(2,114)
2006
6,130
(1,502)
4,628
2007
2,937
(5,316)
(2,379)
2008
763
(300)
463
2009
4 Our group performance 4.2 - 4.2.1
68 Philips Annual Report 2009